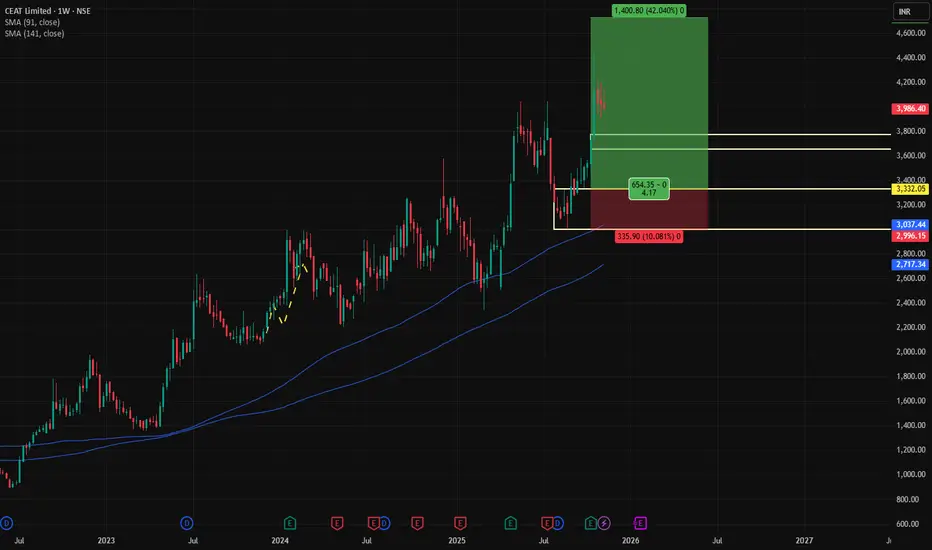
✅ CEAT Multi-Timeframe Analysis
HTF – High Timeframe
TF Zone Trend Analysis Logic Proximal Distal Avg
Yearly UP Demand Rally–Rally 2642 2210 2426
Half-Yearly UP Demand Support 2642 2210 2426
Quarterly UP Demand DMIP 3256 2343 2800
HTF Average UP — — 2847 2254 2551
HTF Summary:
Strong long-term demand zones between 2254 – 2847, confirming a structural uptrend.
MTF – Medium Timeframe
TF Zone Trend Analysis Logic Proximal Distal Avg
Monthly UP Demand DMIP 3334 3000 3167
Weekly UP Demand DMIP 3775 3278 3527
Daily UP Demand Breakout 3775 3655 3715
MTF Average UP CEAT — 3628 3311 3470
MTF Summary:
Medium timeframe structure is strongly bullish.
Critical MTF value zones are 3311 – 3628.
ITF – Intraday Timeframes
TF Trend Analysis Prox Distal Avg
240M UP Demand 3775 3655 3715
180M UP Demand 3775 3655 3715
60M UP Demand 3775 3655 3715
ITF Average UP — 3775 3655 3715
ITF Summary:
Short-term structure aligns with higher timeframe bias = very bullish.
📌 Key Technical Levels
Demand Zones
Major HTF demand: 2210 – 2642
MTF demand cluster: 3000 – 3334
ITF demand: 3655 – 3775
Supply / Resistance
Last high supply: 3800
Major positional target zone: 4655 – 5144
Gann high confirming uptrend: 4000
Gann low marking downtrend: 2600
💼 Trade Plan – CEAT
Entry Plan
Entry 1: 3334
Entry 2: 3775
Average Entry: 3555
Total Quantity: 300
Total Buy Value: ₹1,066,350
Risk Parameters
Stop Loss: 3000
Risk per share: 334
Total Risk: 100,200
Net Loss (incl. brokerage): 105,427
🎯 Targets
First Target: 4655
Positional Target: 5144
Upside Potential: 5144 (from average entry 3555)
RR Ratio: 4.2
Net RR: 4.20
💰 Profit Calculations
If Target 4655 Hits
First Profit Booking (70%): ₹257,498
Remaining Profit (30%): ₹190,050
Total Expected Profit: ₹447,548
Net Profit After Charges: ₹442,320
📈 Real ROI (4-month holding period)
Capital deployed: ₹533,175
Interest @ 9.69% p.a: ₹51,665 (cost of capital)
Net Profit after interest: ₹390,656
Real ROI for 4 months = 73%
🔍 Conclusion
CEAT is in a multi-timeframe confirmed uptrend with strong demand across all TFs:
✔ Best Buy Zone (High Probability)
3555 – 3334
(Your planned entries align perfectly)
✔ SL Strong & Logical
3000 (below major MTF & HTF demand)
✔ Target 5144 is realistic
Based on:
MTF structure
Quarterly DMIP
Positional breakout structure
✔ Perfect RR of 4.2
Makes the trade highly attractive.
Disclaimer
The information and publications are not meant to be, and do not constitute, financial, investment, trading, or other types of advice or recommendations supplied or endorsed by TradingView. Read more in the Terms of Use.
Disclaimer
The information and publications are not meant to be, and do not constitute, financial, investment, trading, or other types of advice or recommendations supplied or endorsed by TradingView. Read more in the Terms of Use.
