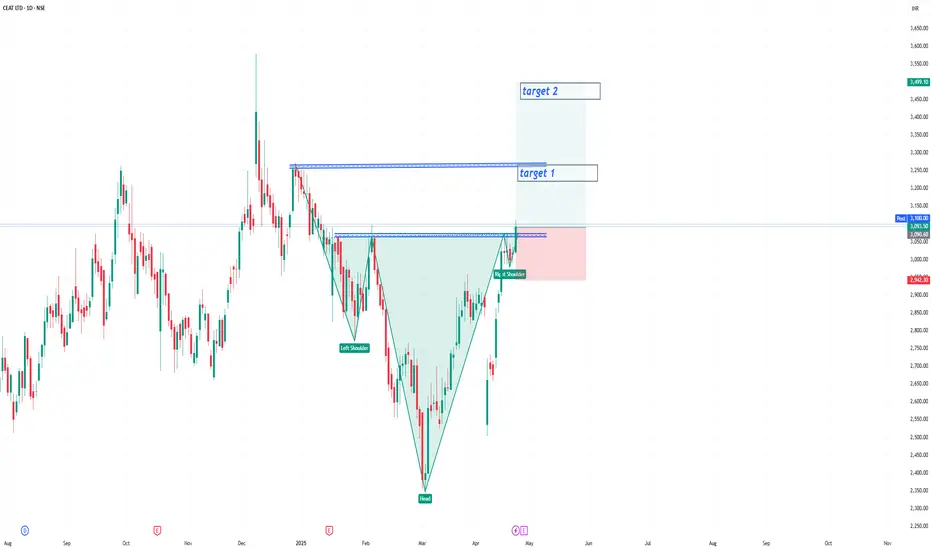
CEAT Ltd has formed a classic Cup & Handle pattern on the daily chart, indicating a strong bullish continuation setup.
Breakout supported by increasing volume
Retest zone: 3,000 – 3,050 (Good entry opportunity)
SL: 2,870 (below handle support)
📈 Targets:
T1: 3,300
T2: 3,500
T3: 3,900 (measured move target)
💡 Bias: Bullish continuation | Swing to Positional
🕒 Timeframe: Daily Chart
Breakout supported by increasing volume
Retest zone: 3,000 – 3,050 (Good entry opportunity)
SL: 2,870 (below handle support)
📈 Targets:
T1: 3,300
T2: 3,500
T3: 3,900 (measured move target)
💡 Bias: Bullish continuation | Swing to Positional
🕒 Timeframe: Daily Chart
Disclaimer
The information and publications are not meant to be, and do not constitute, financial, investment, trading, or other types of advice or recommendations supplied or endorsed by TradingView. Read more in the Terms of Use.
Disclaimer
The information and publications are not meant to be, and do not constitute, financial, investment, trading, or other types of advice or recommendations supplied or endorsed by TradingView. Read more in the Terms of Use.