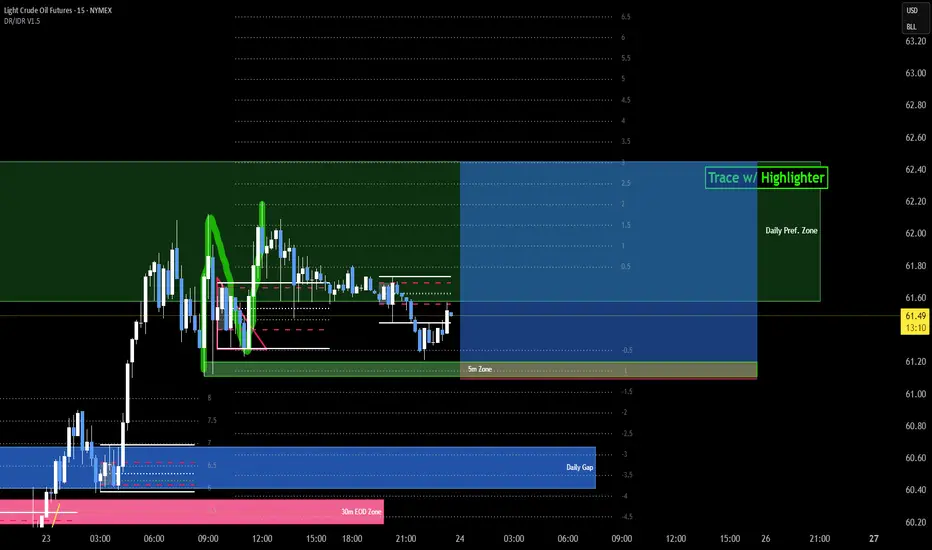
Important to Highlight the price action to show where exactly the new high is (tp), where is the liquidity that should be just above the zone, and the source of the move (the zone using the 5 minute chart).
I look for the last "doji" before the move that closed in the opposite direction.
So, in this idea, the zone is based on the last down doji candle before the up move.
And for longs, I mark the zone starting at the Open of the doji candle and down to the lowest point of that doji wick.
I look for the last "doji" before the move that closed in the opposite direction.
So, in this idea, the zone is based on the last down doji candle before the up move.
And for longs, I mark the zone starting at the Open of the doji candle and down to the lowest point of that doji wick.
Disclaimer
The information and publications are not meant to be, and do not constitute, financial, investment, trading, or other types of advice or recommendations supplied or endorsed by TradingView. Read more in the Terms of Use.
Disclaimer
The information and publications are not meant to be, and do not constitute, financial, investment, trading, or other types of advice or recommendations supplied or endorsed by TradingView. Read more in the Terms of Use.