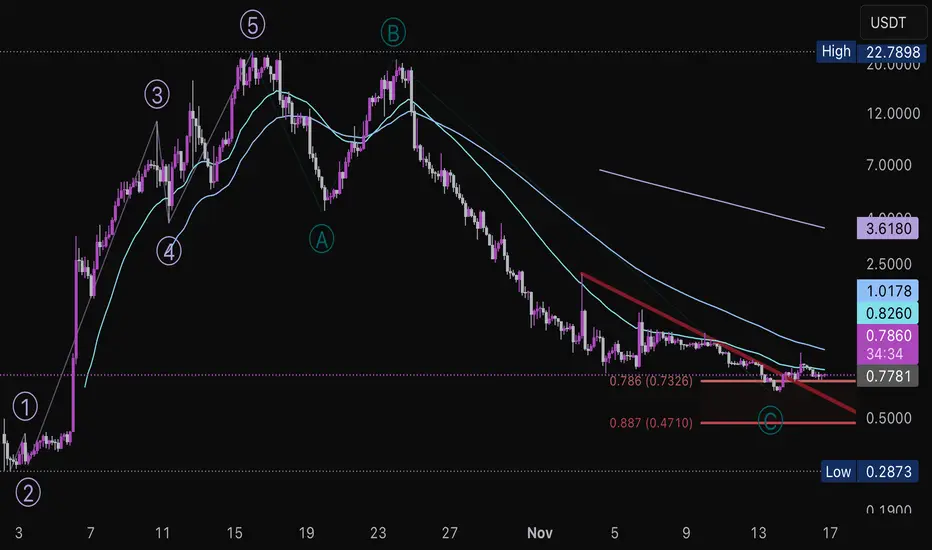
COAI recently broke above the descending trend line after hitting the 78.6 fibonacci retracement of the sharp move up in early October. The chart can be interpreted as 5 waves up and 3 down, potentially creating a long opportunity up to recent high and perhaps even larger if this is the start of a larger cycle.
Alternatively, this retracement could also be a B wave, in which case a rally is still expected.
A sustained break above $0.99 will be needed as a first signal of trend reversal.
Alternatively, this retracement could also be a B wave, in which case a rally is still expected.
A sustained break above $0.99 will be needed as a first signal of trend reversal.
Disclaimer
The information and publications are not meant to be, and do not constitute, financial, investment, trading, or other types of advice or recommendations supplied or endorsed by TradingView. Read more in the Terms of Use.
Disclaimer
The information and publications are not meant to be, and do not constitute, financial, investment, trading, or other types of advice or recommendations supplied or endorsed by TradingView. Read more in the Terms of Use.