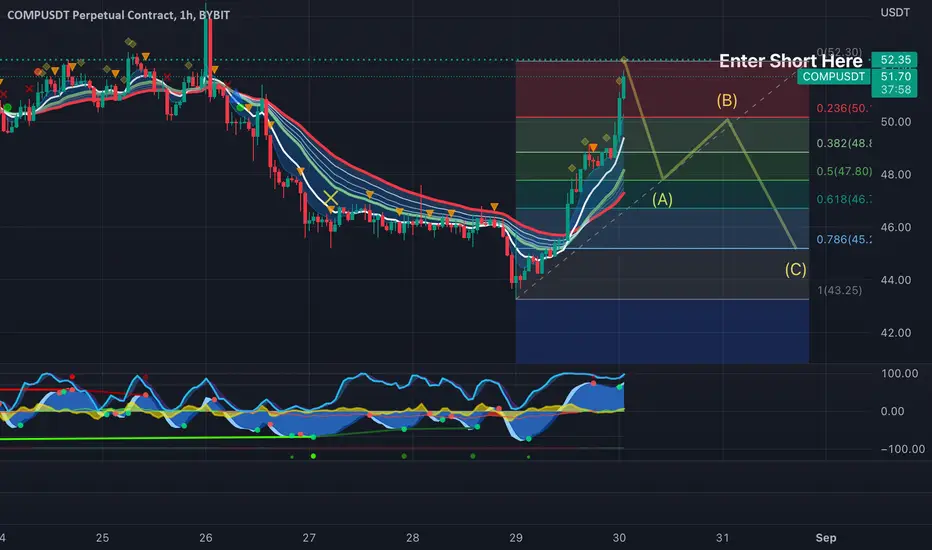
COMP is about to hit its resistance and these are the targets for its corrective move. I have the ABC correction aligned with fib levels. I expect COMP to retrace based on other indicators I see on the higher time frames. The RSI and Momentum have been over extended for quite awhile. I don't see it breaking its resistance like that.
This chart based off of The Elliot Wave Theory, Fibonacci, EMA’s, MacD , RSI , Momentum, and resistance/support zones combined with patterns.
This chart based off of The Elliot Wave Theory, Fibonacci, EMA’s, MacD , RSI , Momentum, and resistance/support zones combined with patterns.
Note
Trade closed for a 12% profit. ✅Disclaimer
The information and publications are not meant to be, and do not constitute, financial, investment, trading, or other types of advice or recommendations supplied or endorsed by TradingView. Read more in the Terms of Use.
Disclaimer
The information and publications are not meant to be, and do not constitute, financial, investment, trading, or other types of advice or recommendations supplied or endorsed by TradingView. Read more in the Terms of Use.