COST - Retail Powerhouse In Ideal HTF Position
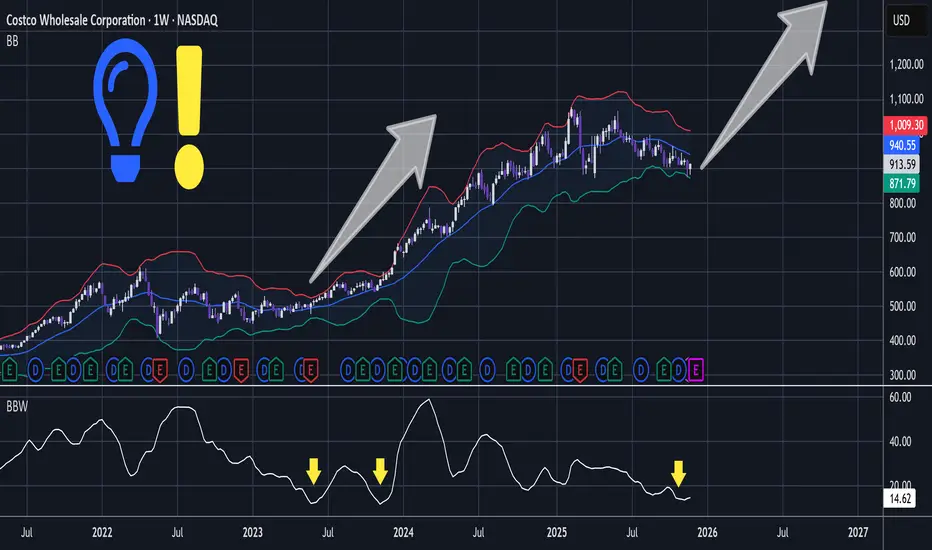
Shallow compressive action has printed contracting Bollinger Bands.
Notice that the BBW - Bollinger Band Width is similar to the previous correction before breakout.
In lower time frame the significantly sized slump has whipsawed through support and wedge trendline to become a bullish engulf:

This event looks likely to be the 8,9 and 10 slump following the Wyckoff Creek of Schematic 1.
And so I think this bullish wedge can also be considered to be a Wyckoff Creek.
Also similar to the Wyckoff schematic, the Creek comes after a long corrective phase - Costco has been in a choppy sideways correction for about a year.
Costco has a very strong trending history and this sideways passage appears to be building pressure for a breakout into the next major wave up.
I am in position already and have more to buy if it pulls back to support @ $932.29 - from there I will just hold.
So I am giving this ideal technical entry to TradingView 👍.
That said DYOR .
This analysis is shared for educational purposes only and does not constitute financial advice. Please conduct your own research before making any trading decisions.
Notice that the BBW - Bollinger Band Width is similar to the previous correction before breakout.
In lower time frame the significantly sized slump has whipsawed through support and wedge trendline to become a bullish engulf:
This event looks likely to be the 8,9 and 10 slump following the Wyckoff Creek of Schematic 1.
And so I think this bullish wedge can also be considered to be a Wyckoff Creek.
Also similar to the Wyckoff schematic, the Creek comes after a long corrective phase - Costco has been in a choppy sideways correction for about a year.
Costco has a very strong trending history and this sideways passage appears to be building pressure for a breakout into the next major wave up.
I am in position already and have more to buy if it pulls back to support @ $932.29 - from there I will just hold.
So I am giving this ideal technical entry to TradingView 👍.
That said DYOR .
This analysis is shared for educational purposes only and does not constitute financial advice. Please conduct your own research before making any trading decisions.
Trade active
I'm noticing on TradingView that I receive more content from publishers that I BOOST / comment on and the algorithm seems to reduce my receiving content from publishers that I have not engaged with their threads.So hit the BOOST / comment if you want to receive more of my content, and obviously that also assists me in reaching more viewers 👍.
Your FA guru can't read a chart💭
I run a technical group with lots of content every day + regular videos, 1:1, chatroom 🚀.
Better than all the rest? My record speaks for itself 💡.
Telegram Group: $50 per month✨.
Contact: t.me/dRends35
I run a technical group with lots of content every day + regular videos, 1:1, chatroom 🚀.
Better than all the rest? My record speaks for itself 💡.
Telegram Group: $50 per month✨.
Contact: t.me/dRends35
Disclaimer
The information and publications are not meant to be, and do not constitute, financial, investment, trading, or other types of advice or recommendations supplied or endorsed by TradingView. Read more in the Terms of Use.