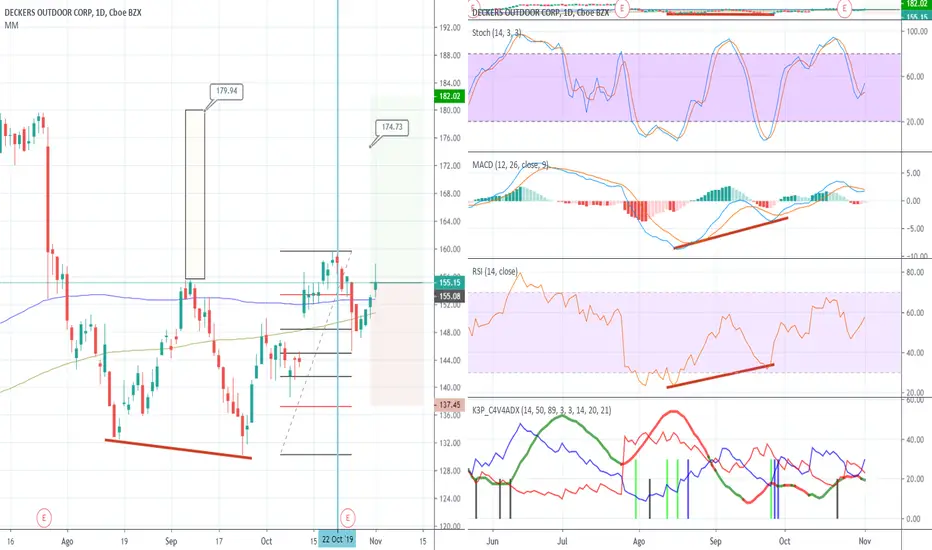
Deck con divergencia alcista, podemos ver como el Rsi y macd (linea roja) tienen bajos mas altos y el grafico esta haciendo bajos + bajos.
De superar los 156 activa divergencia con objetivo minimo de los 179
De superar los 160 activaria fase 2 fibonacci con objetivo de 174.5
Asi como nuevo indicador K3P_C4V4ADX (linea azul de grafico de indicadores nos dio entrada
De superar los 156 activa divergencia con objetivo minimo de los 179
De superar los 160 activaria fase 2 fibonacci con objetivo de 174.5
Asi como nuevo indicador K3P_C4V4ADX (linea azul de grafico de indicadores nos dio entrada
Disclaimer
The information and publications are not meant to be, and do not constitute, financial, investment, trading, or other types of advice or recommendations supplied or endorsed by TradingView. Read more in the Terms of Use.
Disclaimer
The information and publications are not meant to be, and do not constitute, financial, investment, trading, or other types of advice or recommendations supplied or endorsed by TradingView. Read more in the Terms of Use.