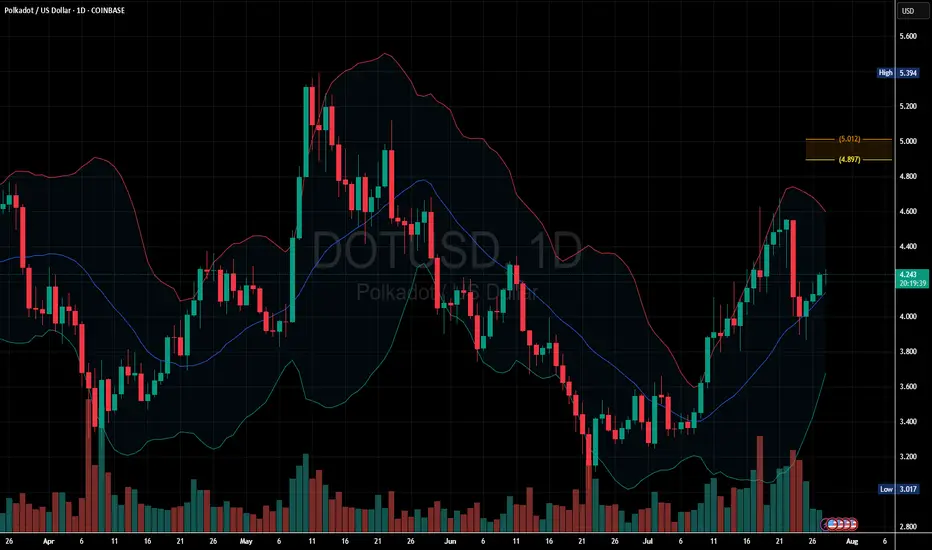
- DOT is trading above the 20-day moving average (middle band of the Bollinger Bands), which is a bullish signal suggesting upward momentum.
- If price holds above the middle Bollinger Band, the bullish bias remains intact.
- A close below it could weaken the short-term bullish case.
- Key support: $4.20–$4.00
- Key resistance: $4.60 (break above confirms continuation)
➀➁➂➃➄
Disclaimer
The information and publications are not meant to be, and do not constitute, financial, investment, trading, or other types of advice or recommendations supplied or endorsed by TradingView. Read more in the Terms of Use.
➀➁➂➃➄
Disclaimer
The information and publications are not meant to be, and do not constitute, financial, investment, trading, or other types of advice or recommendations supplied or endorsed by TradingView. Read more in the Terms of Use.