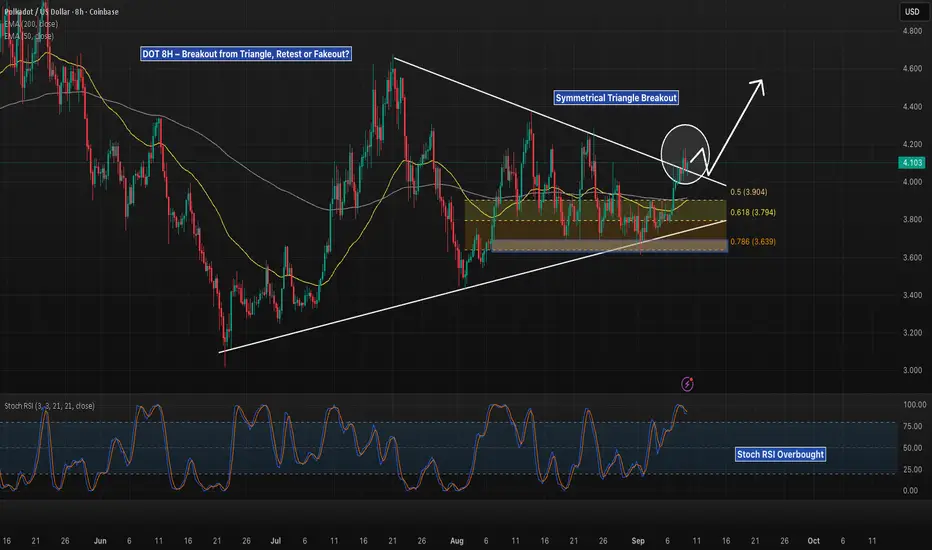
Polkadot has broken above its symmetrical triangle structure, pushing through the EMAs and briefly clearing resistance near $4.10. Price is now retesting the breakout zone, with Fib confluence levels stacked between $3.90–3.63 as support.
Upside potential:
Sustaining above $4.10 could open a move toward $4.40–4.60 range.
Downside invalidation:
A failed retest and close back under $3.90 risks dragging DOT into the Fib retracement cluster ($3.79–3.63).
Stoch RSI is heavily overbought, suggesting pullback risk in the short term, but structure favors continuation if $4.00 holds as support.
📊 Key focus: Does DOT confirm the breakout by holding above EMAs and Fib 0.5, or is this another fakeout before dropping back into the range?
Explore 5,000 Strategies at quanttradingpro.com
Search for the most profitable, lowest risk by symbol!
Search by indicators like Supertrend, Ichimoku, macd.
Join our discord discord.gg/2systG9frc
We provide education & tools.
Search for the most profitable, lowest risk by symbol!
Search by indicators like Supertrend, Ichimoku, macd.
Join our discord discord.gg/2systG9frc
We provide education & tools.
Disclaimer
The information and publications are not meant to be, and do not constitute, financial, investment, trading, or other types of advice or recommendations supplied or endorsed by TradingView. Read more in the Terms of Use.