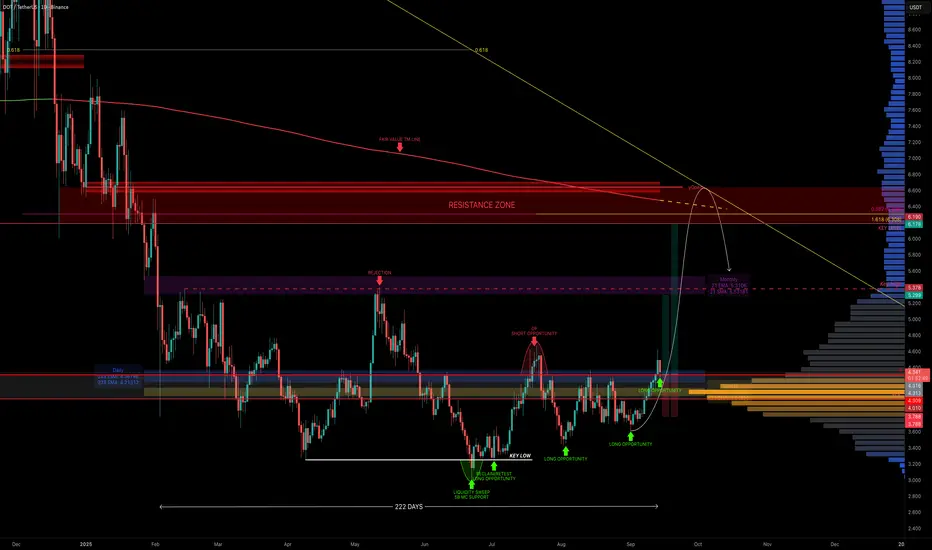
DOT has been in sideways chop for 222 days, but things are finally getting interesting. Price is now sitting above the yearly level ($4.309), the daily 233 EMA/SMA, and the weekly 21 EMA/SMA. Even better, it reclaimed the POC of the entire 222-day range.

Why $4 Is So Important
That’s a whole lot of support stacked at one zone.

Where It Gets Exciting (Targets)
First major target is the monthly 21 EMA/SMA ($5.3–$5.5), which also lines up with the range highs. That’s the first real test. The swing target zone sits around $6–$6.5, with multiple layers of confluence:
📌 This creates a solid resistance cluster between $6–$6.6, ideal for taking profits and potentially looking for shorts.
🟢 Long Trade Idea
Key Levels
🔍 Indicators used
➡️ Available for free. You can find it on my profile under “Scripts” and apply it directly to your charts for extra confluence when planning your trades.
_________________________________
💬 If you found this helpful, drop a like and comment!
Why $4 Is So Important
- Yearly level → $4.309
- Daily 233 EMA → $4.37 / Daily 233 SMA → $4.21
- Weekly 21 EMA → $4.15 / Weekly 21 SMA → $4.05
- POC of 222-day range → $4
- 0.618 Fib retracement (current move) → $4
That’s a whole lot of support stacked at one zone.
Where It Gets Exciting (Targets)
First major target is the monthly 21 EMA/SMA ($5.3–$5.5), which also lines up with the range highs. That’s the first real test. The swing target zone sits around $6–$6.5, with multiple layers of confluence:
- Key Level → ~$6
- Fair Value Trend Model Line → ~$6.5
- 0.382 Fib retracement of the downtrend → ~$6.19
- 0.618 Fib speed fan → ~$6.2 (October projection)
- 1.618 trend-based Fib extension → $6.308
- Market Cap Confluence: 10B market cap at $6.18
- Yearly Open: $6.642 → the overall target and an additional layer of resistance
📌 This creates a solid resistance cluster between $6–$6.6, ideal for taking profits and potentially looking for shorts.
🟢 Long Trade Idea
- Entry: Ladder longs from $4.36 down to $4
- Stop: Below $4 (clear invalidation)
- Take Profit: If $4 holds, DOT’s path is clear: first stop $5.3-$5.5, then $6.0–$6.6 as the macro target with the yearly open at $6.642 marking the final resistance.
Key Levels
- Support → $4.36–$4
- Resistance → $5.3–$5.5, then $6.2–$6.6 (10B market cap $6.18 + yearly open $6.642)
🔍 Indicators used
- LuxAlgo — Liquidity Sentiment Profile (Auto-Anchored)
- DriftLine — Pivot Open Zones [SiDec] → For identifying key yearly/monthly/weekly/daily opens that act as major S/R reference points
- Multi Timeframe 8x MA Support Resistance Zones [SiDec] → to identify support and resistance zones such as the monthly 21 EMA/SMA.
- Fair Value Trend Model [SiDec] → Calculates a regression-based fair value curve
➡️ Available for free. You can find it on my profile under “Scripts” and apply it directly to your charts for extra confluence when planning your trades.
_________________________________
💬 If you found this helpful, drop a like and comment!
Note
DOT Update — Battling to Reclaim the Yearly LevelDOT lost the yearly level as support but quickly found footing at the 0.5 Fib retracement ($4.119) from the $3.6 swing low. As mentioned earlier in the comments, the $4.1 zone was the ideal long entry, backed by multiple layers of confluence:
→ 0.5 Fib retracement at $4.119
→ Weekly level at $4.11
→ Anchored VWAP from the $3.612 swing low aligning right on the weekly level
→ 0.618 Fib speed fan just below as extra support
Price has reacted well from this zone, but the current obstacle is the anchored VWAP from the $4.626 swing high, sitting close to the yearly level.
📌 For DOT to continue higher, it needs a clean break and retest of the yearly level to confirm bullish momentum.
🏆 Mastering Fibonacci for precision trading
🔹 Sharing high-probability trade setups
⚡ Unlock the power of technical analysis!
🔹 Sharing high-probability trade setups
⚡ Unlock the power of technical analysis!
Related publications
Disclaimer
The information and publications are not meant to be, and do not constitute, financial, investment, trading, or other types of advice or recommendations supplied or endorsed by TradingView. Read more in the Terms of Use.
