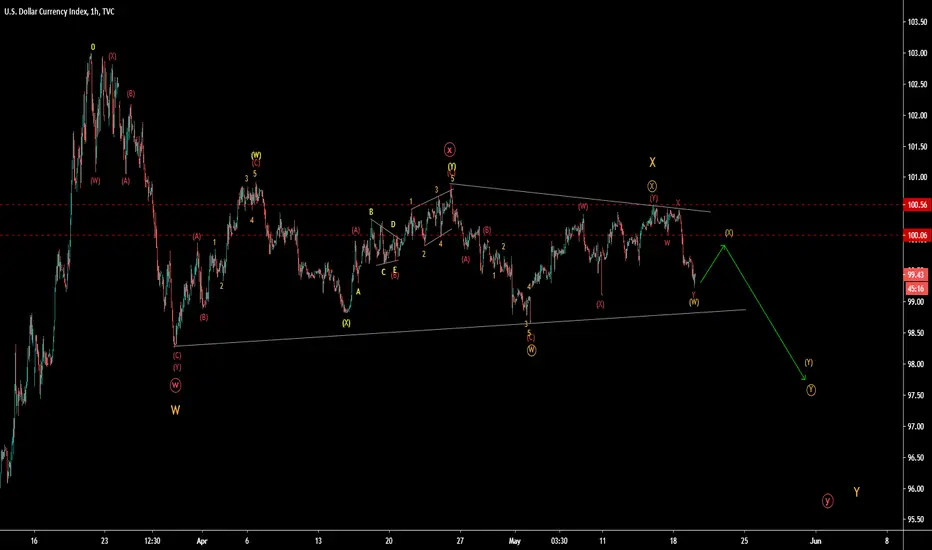
US Dollar (DXY) is in WXY pattern as shown in chart. X wave was bigger complex wave and spent a huge time with almost no price movement. Y wave is subdividing in wxy, where w & x wave are over. y wave is again subdividing as shown in chart as complex correction.
Disclaimer
The information and publications are not meant to be, and do not constitute, financial, investment, trading, or other types of advice or recommendations supplied or endorsed by TradingView. Read more in the Terms of Use.
Disclaimer
The information and publications are not meant to be, and do not constitute, financial, investment, trading, or other types of advice or recommendations supplied or endorsed by TradingView. Read more in the Terms of Use.