DXY on the 1H time-frame.
Steps:
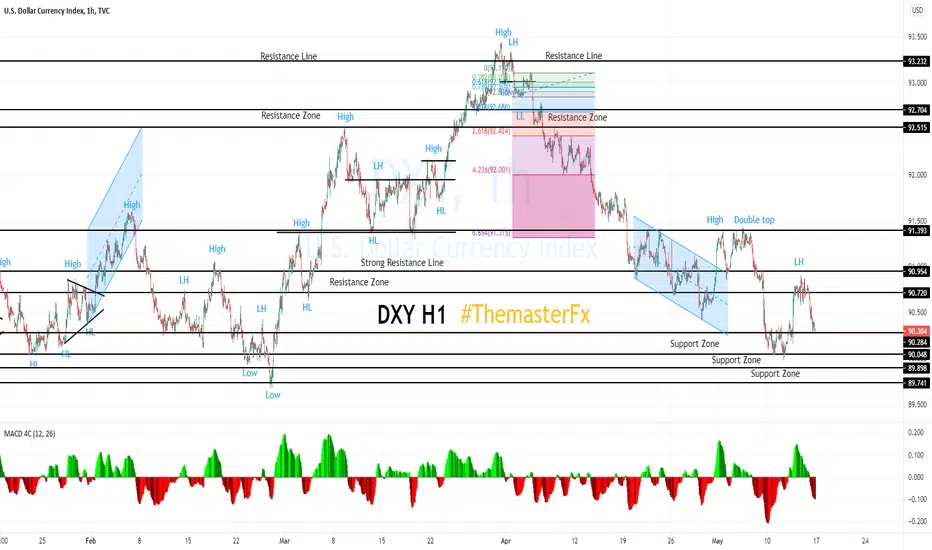
1. The index formed double top at the strong resistance line and after that breakout the previous low to confirmed the reversal pattern.
2. The index created the lower high and its running downtrend to the support zone.
3. The strong support zone are 90.284 90.048 89.898 and 89.741
Steps:
1. The index formed double top at the strong resistance line and after that breakout the previous low to confirmed the reversal pattern.
2. The index created the lower high and its running downtrend to the support zone.
3. The strong support zone are 90.284 90.048 89.898 and 89.741
Disclaimer
The information and publications are not meant to be, and do not constitute, financial, investment, trading, or other types of advice or recommendations supplied or endorsed by TradingView. Read more in the Terms of Use.
Disclaimer
The information and publications are not meant to be, and do not constitute, financial, investment, trading, or other types of advice or recommendations supplied or endorsed by TradingView. Read more in the Terms of Use.