Based on the ETH/USD daily chart you shared, here’s a professional breakdown:
🔎 Technical Overview
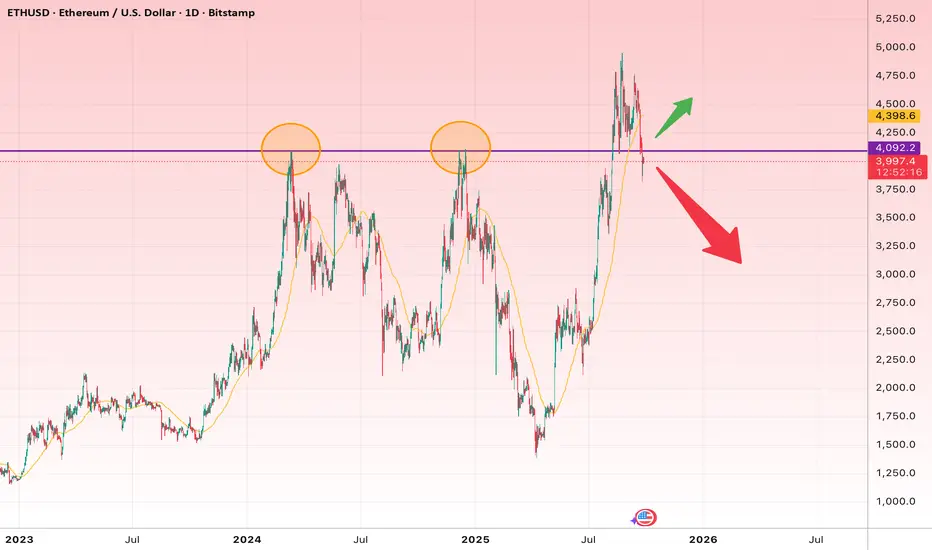
Key Level: $4,000 – $4,100
This zone is a multi-year resistance (price was rejected here twice before → double top).
Currently, price is sitting just below this line — a true decision point.
Pattern Outlook
A confirmed breakout above $4,100 could open the way for a strong bullish rally.
A rejection here could trigger a deep correction, similar to the past two times.
100-Day Moving Average
Acting as dynamic mid-term support. A clean break below it would be a strong bearish signal.
📈 Short-Term Outlook (1–3 weeks)
Bullish Scenario:
Break and daily close above $4,100–$4,200 → Target 1: $4,500, Target 2: $4,850.
Stop-loss: Daily close below $3,900.
Bearish Scenario:
Rejection and breakdown below $3,850 → Target 1: $3,400, Target 2: $3,000.
Stop-loss: Daily close above $4,150.
📊 Long-Term Outlook (3–9 months)
Bullish (if resistance breaks):
Mid-term targets: $5,250 (next historical peak) → then potentially $6,000–$6,500 if momentum continues.
Stop-loss: Sustained close below $3,400.
Bearish (if resistance holds):
Likely correction towards $2,750–$3,000.
In a broader market downturn, a retest of $2,200–$2,400 is also possible.
⚠️ Key Takeaway: Price is sitting at a critical resistance zone. Risk management is crucial — trading without a stop-loss here could be dangerous.
Disclaimer
The information and publications are not meant to be, and do not constitute, financial, investment, trading, or other types of advice or recommendations supplied or endorsed by TradingView. Read more in the Terms of Use.
Disclaimer
The information and publications are not meant to be, and do not constitute, financial, investment, trading, or other types of advice or recommendations supplied or endorsed by TradingView. Read more in the Terms of Use.