Ethereum (4H) Alert: Weakening Strength & Key Support Levels
Disclaimer:
The information provided in this chart is for educational and informational purposes only and should not be considered as investment advice. Trading and investing involve substantial risk and are not suitable for every investor. You should carefully consider your financial situation and consult with a financial advisor before making any investment decisions. The creator of this chart does not guarantee any specific outcome or profit and is not responsible for any losses incurred as a result of using this information. Past performance is not indicative of future results. Use this information at your own risk. This chart has been created for my own improvement in Trading and Investment Analysis. Please do your own analysis before any investments.
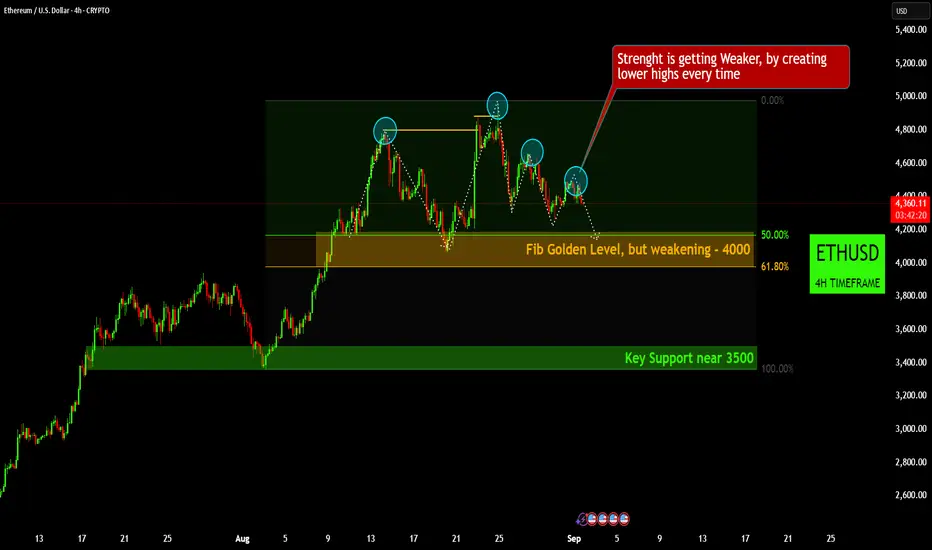
- Fading Momentum: We're seeing clear signs that bullish strength is weakening. Ethereum has been creating a pattern of "lower highs" since its recent peak, indicating that sellers are gaining control on bounces.
- Fibonacci Level Under Pressure: The "Fib Golden Level" around $4,000 is a crucial support, but it appears to be weakening. This suggests that if selling pressure continues, this level might not hold firmly.
- Key Support Zone: If the current levels fail, the next major "Key Support" area we'll be watching is near $3,500. This will be a critical zone for potential buyers to step in and prevent further significant declines.
- Short-Term Outlook: Given the series of lower highs and the weakening Fibonacci support, traders should be cautious. The market is signaling a potential continuation of this correctional phase unless we see a strong reversal of the current downtrend.
Disclaimer:
The information provided in this chart is for educational and informational purposes only and should not be considered as investment advice. Trading and investing involve substantial risk and are not suitable for every investor. You should carefully consider your financial situation and consult with a financial advisor before making any investment decisions. The creator of this chart does not guarantee any specific outcome or profit and is not responsible for any losses incurred as a result of using this information. Past performance is not indicative of future results. Use this information at your own risk. This chart has been created for my own improvement in Trading and Investment Analysis. Please do your own analysis before any investments.
Disclaimer
The information and publications are not meant to be, and do not constitute, financial, investment, trading, or other types of advice or recommendations supplied or endorsed by TradingView. Read more in the Terms of Use.
Disclaimer
The information and publications are not meant to be, and do not constitute, financial, investment, trading, or other types of advice or recommendations supplied or endorsed by TradingView. Read more in the Terms of Use.