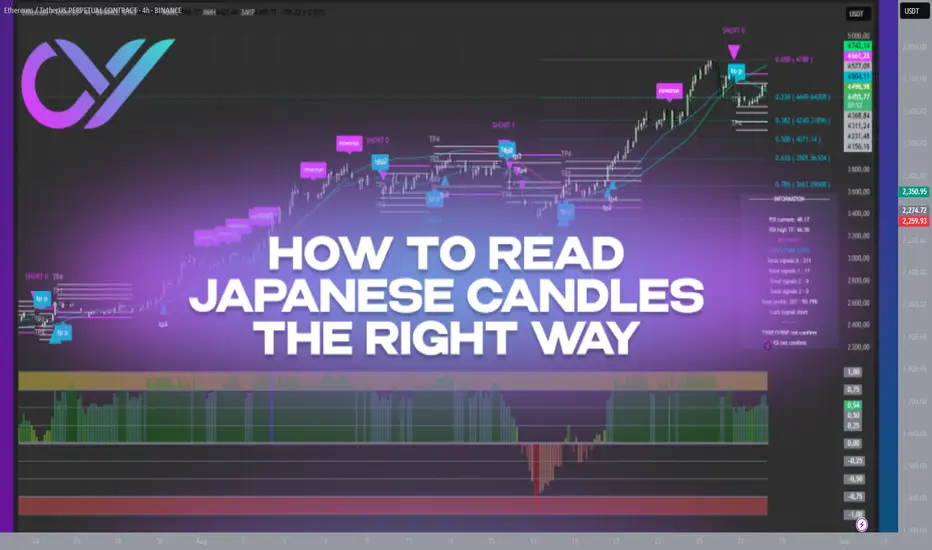
When traders first look at a chart, they often see what looks like a chaotic mix of red and green bars with shadows. These are Japanese candlesticks — the main language of financial markets. But for many, they remain a mystery: what does a long wick mean? Why does one candle look strong while another looks weak? How can you find structure in this chaos?
In reality, candles are not just colored shapes. Each one represents a small battle between buyers and sellers. The body shows where price opened and closed, while the wicks mark the extremes of that session. A green candle reflects bullish control, a red one shows bearish dominance.
The details matter most. A long upper wick signals that buyers tried to push higher but sellers pushed back. A long lower wick means the opposite — heavy selling pressure was absorbed, and buyers regained control. A doji with small body and long wicks highlights indecision and often warns of a possible shift.
Single candles rarely tell the whole story; combinations and context are far more valuable. A “hammer” at support after a downtrend hints at reversal. A “bullish engulfing” pattern after a series of red candles shows momentum shifting to buyers. On the flip side, a “hanging man” near resistance often warns of correction.
Timeframe also changes the narrative. A candle on the 1-minute chart tells a completely different story than a candle on the daily chart. Aligning short-term candles with higher timeframes helps distinguish noise from meaningful moves.
Experienced traders never rely on candles alone — they integrate them into a system. Candles are confirmed with support and resistance, volume dynamics, divergences, and overall trend structure. Only then does a clear picture of the market emerge.
The key, however, is eliminating emotions. Traders who focus only on candles often act chaotically — exiting too early, holding losing trades too long, or entering impulsively. But when combined with algorithmic analysis and structured trade management, candles become a clear language: they show where the market weakens, where momentum builds, and where it makes sense to take profits.
Japanese candlesticks mirror crowd psychology. Yet only a systematic approach allows traders to truly read their signals. When the market looks chaotic, structure and automation bring control back to the trader, turning emotions into cold calculation.
🟣indicator: t.me/CryptoVisionPro_news
🟣Forum: t.me/CryptoVision_Forum
🟣Forum: t.me/CryptoVision_Forum
Disclaimer
The information and publications are not meant to be, and do not constitute, financial, investment, trading, or other types of advice or recommendations supplied or endorsed by TradingView. Read more in the Terms of Use.
