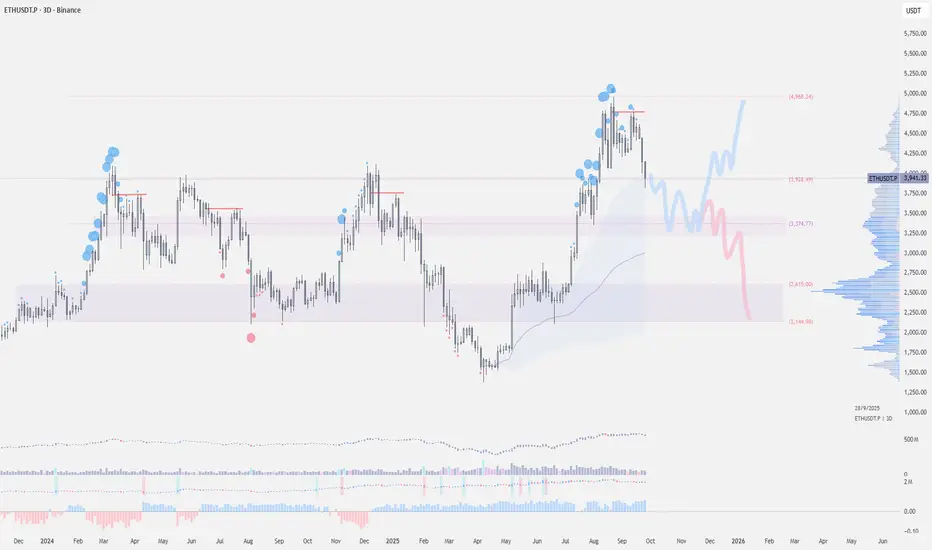
Ethereum has experienced a roughly 13% decline over the past week, primarily due to deleveraging triggered by shifting expectations around rate cuts. The chart indicates that each time the price tests a previous high for the second time, it tends to decline in a bearish retest.
The $3800 level is a critical support zone. If this support holds, it could pave the way for a rally, potentially retesting the $4800–$5000 range.
However, a break below $3,800 could lead to further declines, targeting the $3500–$3200 zone. In a more bearish scenario, a drop to $2600–$2400 is possible.
Tealstreet.io Trade Faster & Trade Easier
Content in partnership with:
twitter.com/mooncakexbt
twitter.com/huskyXBT
Content in partnership with:
twitter.com/mooncakexbt
twitter.com/huskyXBT
Disclaimer
The information and publications are not meant to be, and do not constitute, financial, investment, trading, or other types of advice or recommendations supplied or endorsed by TradingView. Read more in the Terms of Use.