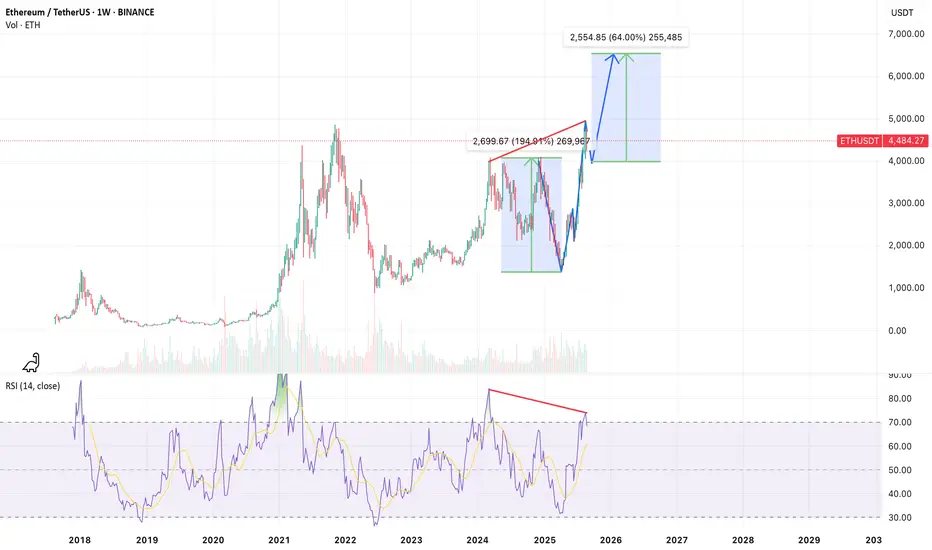
On the weekly timeframe, ETHUSDT is showing signs of a potential V-sharp reversal pattern. A mild bearish divergence can be observed at the recent highs, indicating the likelihood of a corrective move toward the $4,000 support zone before resuming the broader bullish trend targeting the $6,500 area.
For educational purposes only. This is not financial advice.
For educational purposes only. This is not financial advice.
Note
Update1: ETH moved to $4k zone, let's wait & see if it can resume the bullish trend.Disclaimer
The information and publications are not meant to be, and do not constitute, financial, investment, trading, or other types of advice or recommendations supplied or endorsed by TradingView. Read more in the Terms of Use.
Disclaimer
The information and publications are not meant to be, and do not constitute, financial, investment, trading, or other types of advice or recommendations supplied or endorsed by TradingView. Read more in the Terms of Use.