Description:
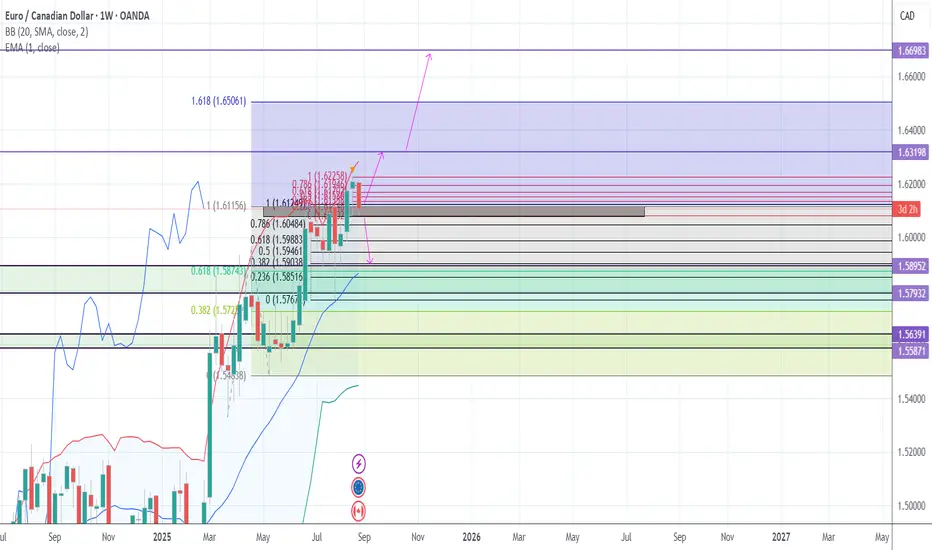
Multi-timeframe analysis using Fibonacci retracement on EURCAD.
The Fibonacci retracement is drawn from the swing low at 1.49 to the swing high at 1.6225.
Key Levels:
0.382 (1.5722) → major support zone
0.618 (1.5874) → strong support, key bullish level
0.786 (1.6048) → current resistance/test area
Extension 1.618 (1.6506) → long-term bullish target
Scenarios:
Bullish: If price holds above 1.6040 – 1.5980, next targets are 1.6225 and 1.6500 (Fibo extension).
Bearish retracement: A break below 1.6040 could push the pair lower towards 1.5870 – 1.5720 support zone.
Position Management:
Stop Loss placed just below the previous closed weekly candle (weekly spike).
Trailing Stop of 1–1.5 ATR, always adjusted below the latest weekly spike.
Partial profits can be taken near 2.00, while the main bullish target remains 1.65 (Fibo extension).
Conclusion:
The weekly chart shows EURCAD testing the 0.786 retracement.
As long as it holds, the broader trend remains bullish towards 1.62 – 1.65.
Failure to hold above 1.6040 may trigger a deeper retracement to 1.5870/1.5720.
Disclaimer
The information and publications are not meant to be, and do not constitute, financial, investment, trading, or other types of advice or recommendations supplied or endorsed by TradingView. Read more in the Terms of Use.
Disclaimer
The information and publications are not meant to be, and do not constitute, financial, investment, trading, or other types of advice or recommendations supplied or endorsed by TradingView. Read more in the Terms of Use.