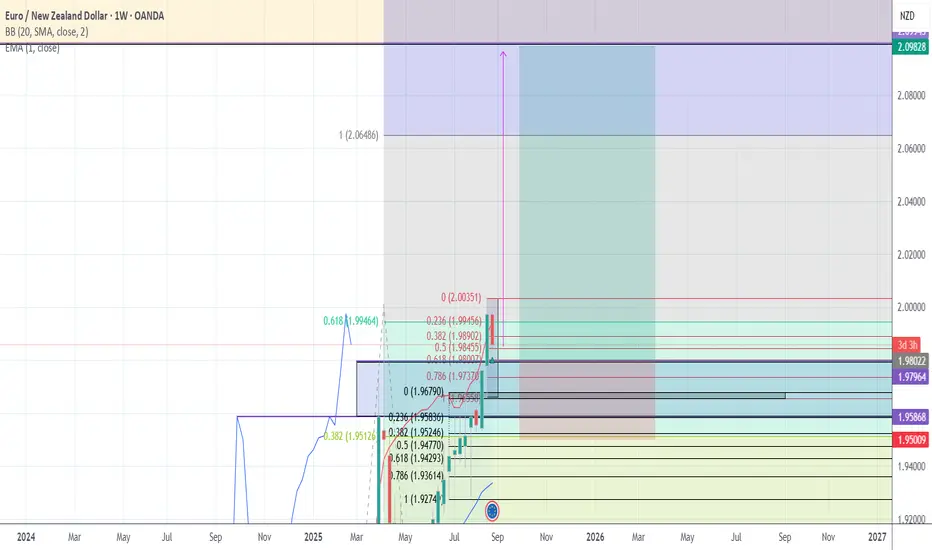
Multi-timeframe analysis using Fibonacci retracement.
The black Fibonacci is drawn from the monthly closed candle (higher timeframe trend).
The red Fibonacci is drawn from the weekly closed candle (shorter-term retracement).
Key Levels:
0.236 (1.9945) → first resistance
0.382 (1.9890) & 0.5 (1.9850) → intermediate support zones
0.618 (1.9804) → main support level
0.786 (1.9737) → critical support; a break below may extend towards 1.9670 – 1.9520
If support holds, the next bullish target is around 2.00 – 2.0648 (Fibo extension)
Position Management:
Stop Loss is placed just below the previous closed weekly candle (weekly spike).
A trailing stop of 1–1.5 ATR is used, always adjusted below the latest weekly spike.
This provides protection while letting the trend run.
Partial profits can be taken near 2.00, while the main bullish target remains 2.06 (Fibo extension).
Disclaimer
The information and publications are not meant to be, and do not constitute, financial, investment, trading, or other types of advice or recommendations supplied or endorsed by TradingView. Read more in the Terms of Use.
Disclaimer
The information and publications are not meant to be, and do not constitute, financial, investment, trading, or other types of advice or recommendations supplied or endorsed by TradingView. Read more in the Terms of Use.