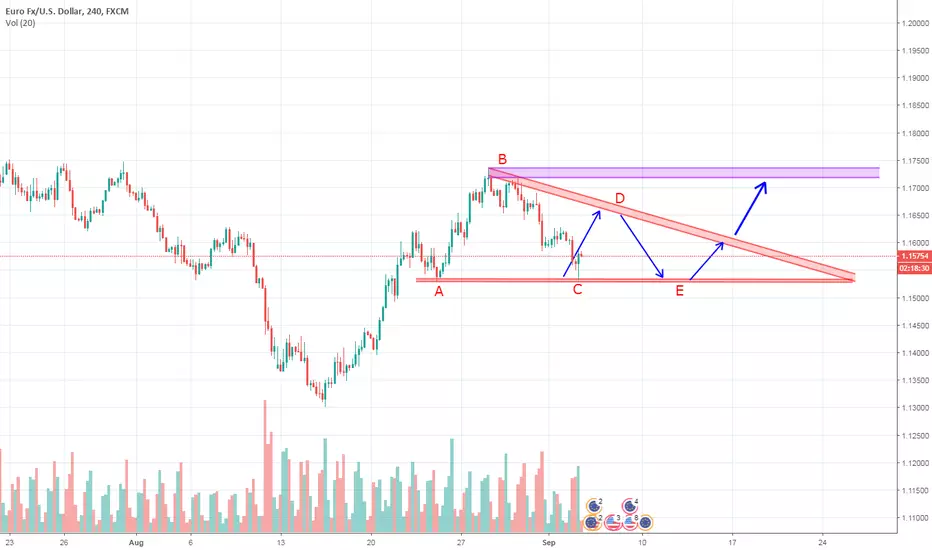
Ok people , this can be real forming of descending triangle on up trend . Our bottom (double bottom) is 1.153 and we headed up to 1.166-1.167 max ... if this number hold, then we will go back down to 1.153 and then only up to 1.172-1.174. This is forecast for next days. If this chart is valid, then we will not go lower then 1.153. And as i wrote from previous chart and today i wrote it many times , i wrote we will go down to 1.153 and then up to 1.163, per this chart we will go to 1.166-7. GL all
Trade active
TP HIT, now lets go downTrade active
TP hit bottom and up ... again 100% hitTrade closed: target reached
Disclaimer
The information and publications are not meant to be, and do not constitute, financial, investment, trading, or other types of advice or recommendations supplied or endorsed by TradingView. Read more in the Terms of Use.
Disclaimer
The information and publications are not meant to be, and do not constitute, financial, investment, trading, or other types of advice or recommendations supplied or endorsed by TradingView. Read more in the Terms of Use.