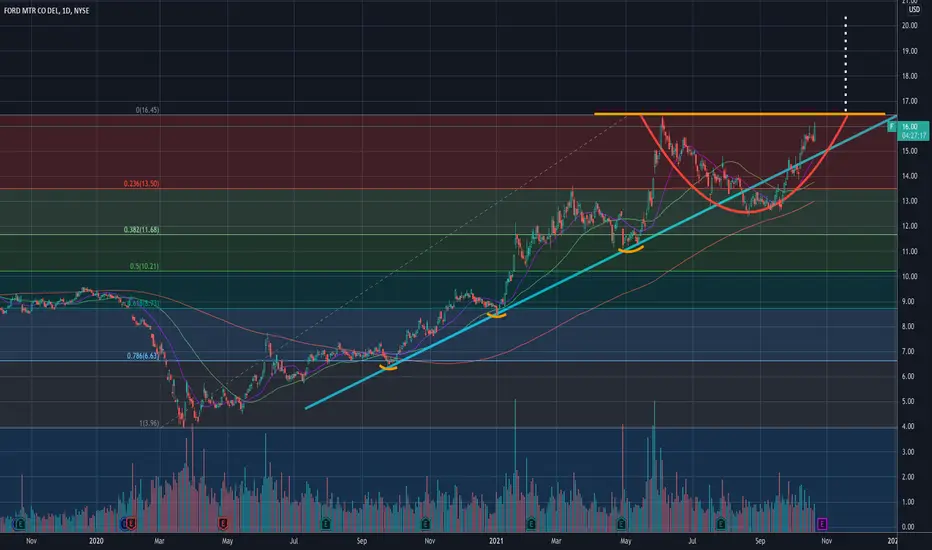
Ford is right now forming a cup. Breaking above the prior high of 16.43 could send the stock to $20!
Which co-insides with the credit susie's analyst's new target price. Perhaps he did it based on technicals as well? :)
Target - $20
———————————————————
How to read my charts?
- Matching color trend lines shows the pattern. Sometimes a chart can have multiple patterns. Each pattern will have matching color trend lines.
- The yellow horizontal lines shows support and resistance areas.
- Fib lines also shows support and resistance areas.
- The dotted white lines shows price projection for breakout or breakdown target.
Disclaimer: Do your own DD. Not an investment advice.
Note
Target reached. It could still continue upward. New chart will come in the future with new targets.I am not a licensed professional. None of the posts that I published are investment advice. Do your own research.
Disclaimer
The information and publications are not meant to be, and do not constitute, financial, investment, trading, or other types of advice or recommendations supplied or endorsed by TradingView. Read more in the Terms of Use.
I am not a licensed professional. None of the posts that I published are investment advice. Do your own research.
Disclaimer
The information and publications are not meant to be, and do not constitute, financial, investment, trading, or other types of advice or recommendations supplied or endorsed by TradingView. Read more in the Terms of Use.