France 40 simple buy set upIf this support level is hold, expect price to match our forecast this is a simple trade

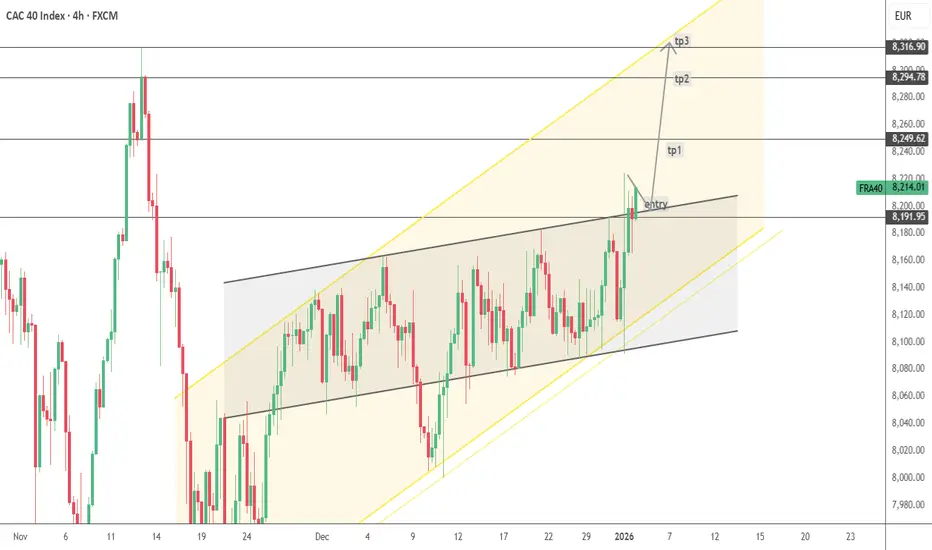
FRA40--Ascending channel--Long bias in ascending channel
--entry and tp levels are as shown on the chart
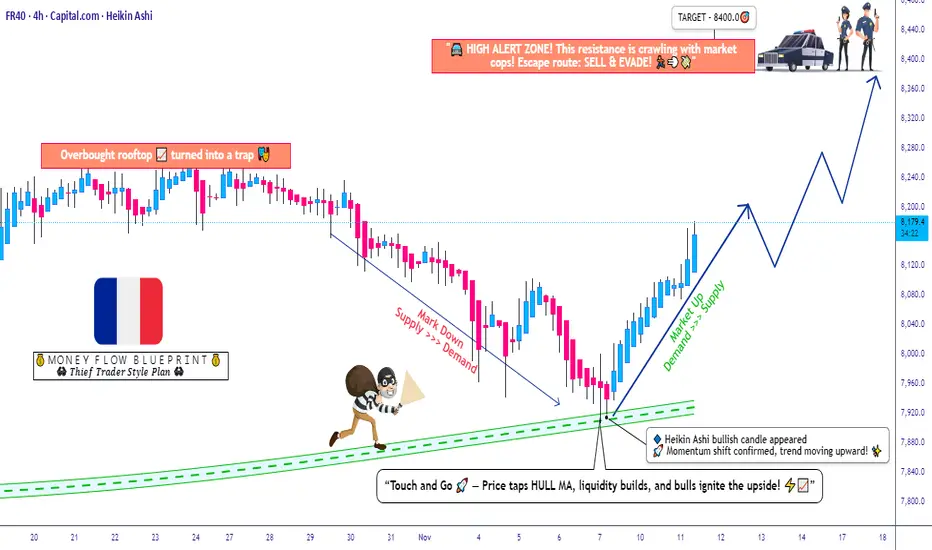
FR40 Bullish Structure | Smart Pullbacks in Control🔷 FR40 / CAC40 — FRANCE 40
📊 Index Market Capital Flow Blueprint (Swing Trade)
🧭 Market Bias
🟢 Bullish Structure Confirmed
Price continues to respect the Triangular Moving Average (TMA) with multiple clean pullbacks, signaling sustained institutional accumulation and healthy trend continuation.
🧠 T

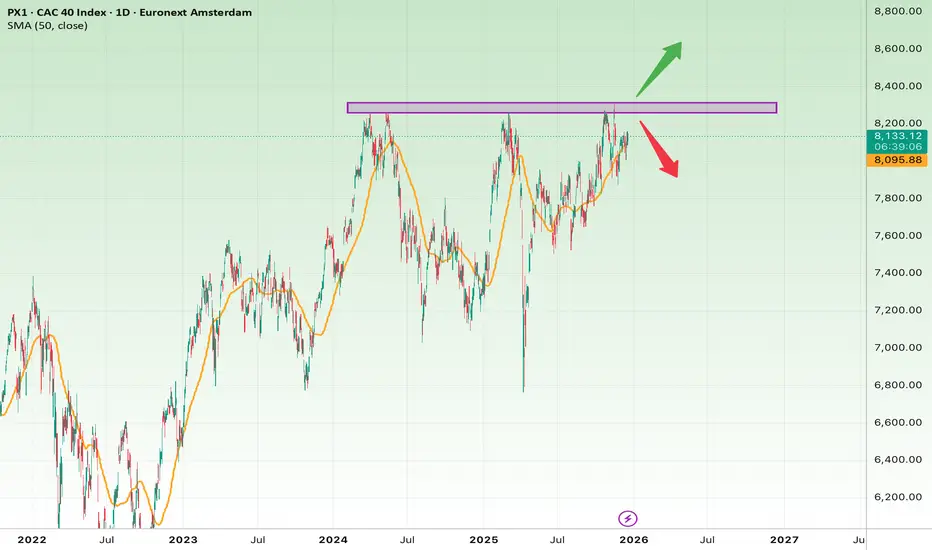
CAC 40 Technical AnalysisThe CAC 40 index is in a medium-term uptrend and is currently testing a major historical resistance zone around 8200–8300.
This zone has triggered multiple strong rejections in the past and now represents a key decision area.
Price remains above the 50-day SMA, confirming bullish structure, but vol
FR40 Swing Opportunity – Reversal Pattern Meets Strong Support🔥 FR40 / CAC40 (France 40) – Bullish Swing Setup | Dynamic Support Reversal Plan
💼 Asset: FR40 / CAC40 (France 40 Index)
📊 Type: Swing Trade Opportunity (Technical + Dynamic Layered Entry Strategy)
🎯 Trade Plan Overview
A strong bullish plan has been confirmed on the France 40 index 🇫🇷, backed by
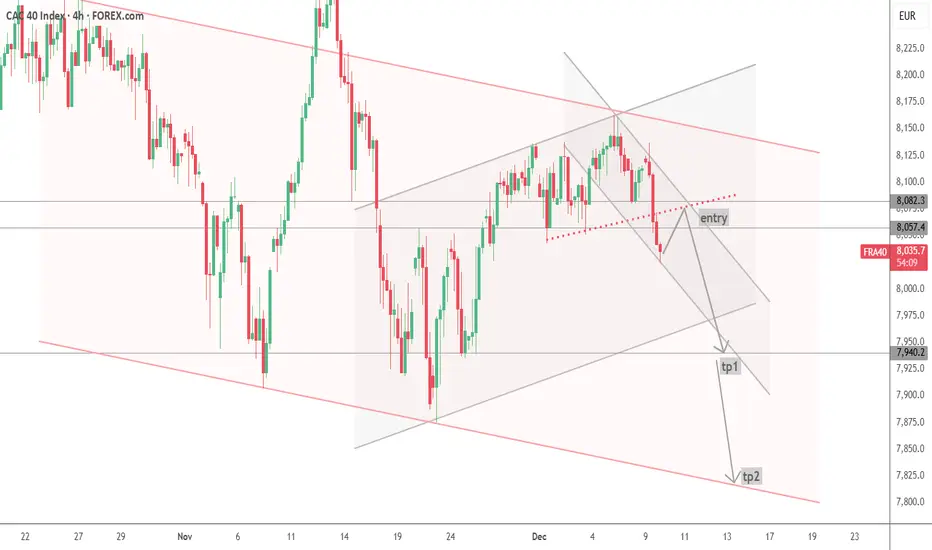
FR40 SHORT THIS BITCH under this level seller are stong ; and they xwill push the price down , the fundamentals are all gathered and france is really having a bad moment over this Q4


CAC 40: Poised for a Major UpsideThe French CAC 40 index — often overshadowed by Wall Street giants — may be standing at the edge of a powerful long-term rally. Beneath the surface, the forces driving this potential upside are not just economic cycles, but structural realities of modern finance.
Over the past decade, the global ec

See all ideas
Displays a symbol's value movements over previous years to identify recurring trends.
Frequently Asked Questions
CAC 40 Index (FCHI) reached its highest quote on Jan 14, 2026 — 8,400.8 EUR. See more data on the CAC 40 Index (FCHI) chart.
The lowest ever quote of CAC 40 Index (FCHI) is 3,516.3 EUR. It was reached on Mar 19, 2020. See more data on the CAC 40 Index (FCHI) chart.
CAC 40 Index (FCHI) is just a number that lets you track performance of the instruments comprising the index, so you can't invest in it directly. But you can buy CAC 40 Index (FCHI) futures or funds or invest in its components.