Like price, support and resistance levels, volume, etc., Fibonacci levels are leading indicators. Most traders don’t use Fibonacci levels alone to take trades but combine them with other indicators to qualify or disqualify trades. Fibonacci retracements are typically used to make a case for entering a trade.
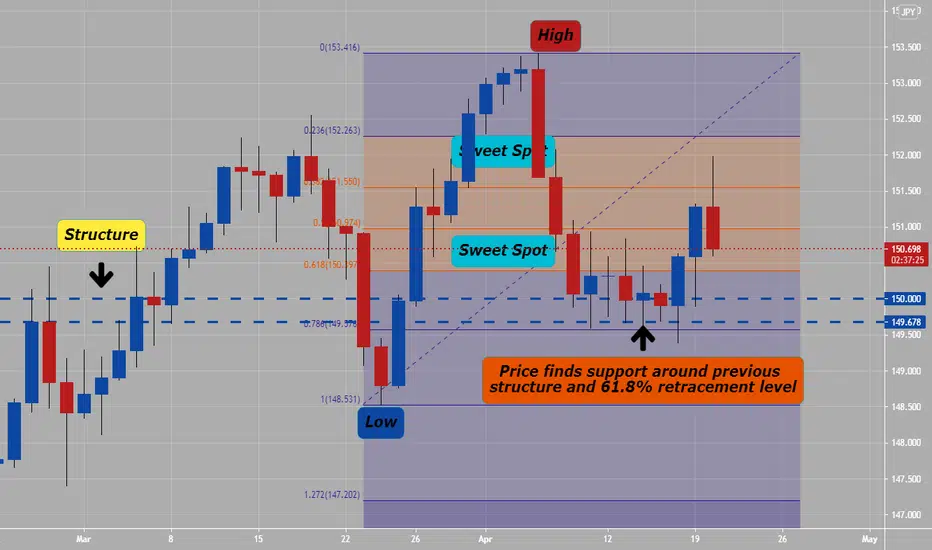
Easiest way to use the regular Fibonacci retracement tool and measure is backward (against the swing – as shown on attached chart example).
Using Fibonacci Retracements
Most traders use Fibonacci retracements for qualifying trade entries. If the retracement has only come down to the 23.6 level or less, there is likely to be a further retracement. A very deep retracement (one that retraces further than the 61.8 level) is often a sign that price is not likely to continue in the direction of the original swing.
If you’re waiting to enter a trade on the retracement of a move, there is a sweet spot in which you’d like to see price bounce and hopefully continue the in the original direction. That sweet spot ranges from about the 38.2 level to the 61.8 level. Note: The 50.0 level is not a Fibonacci ratio, but is usually included in these measurements because price reverses at the 50% retracement level so frequently.
Fibonacci retracements aren’t usually used alone to enter trades. Rather, they are used in combination with other factors in a trading plan to build a case (or qualify) possible entries.Using Fibonacci retracement levels works best after strong and obvious price swings. Don’t force trades where there are none.
Like any other market indicator, Fibonacci retracement and extension levels are just a tool. Using them will not magically make you a good trader if you’re not already good at trading. However, using them in combination with other market factors can help you filter out some bad trades, which is a good thing for any trader. As always, be sure to back test and demo trade any new trading techniques before adding them to your live trading repertoire.
Disclaimer
The information and publications are not meant to be, and do not constitute, financial, investment, trading, or other types of advice or recommendations supplied or endorsed by TradingView. Read more in the Terms of Use.
Disclaimer
The information and publications are not meant to be, and do not constitute, financial, investment, trading, or other types of advice or recommendations supplied or endorsed by TradingView. Read more in the Terms of Use.