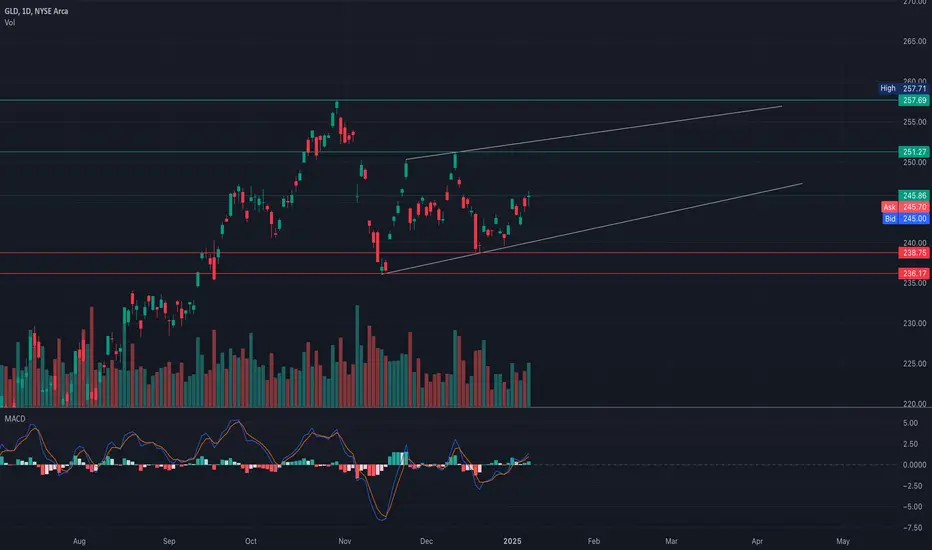
Daily Chart Analysis:
* Trend: GLD is trading within an ascending channel, with higher lows and higher highs forming a bullish structure. The price is approaching the upper resistance line near $257.71, indicating a potential test of this level.
* Support Levels:
* $245.86: Current price zone showing consolidation.
* $238.75: Key swing low, acting as a strong support level.
* $236.17: Major support to watch if a bearish breakdown occurs.
* Resistance Levels:
* $251.27: Intermediate resistance before testing the channel high.
* $257.71: Upper channel resistance.
* Indicators:
* MACD: The MACD is showing bullish momentum with a crossover above the signal line, indicating potential upward continuation.
* Volume: Increasing volume on bullish days suggests strong buyer interest.
30-Min Chart Analysis:

* Gamma Exposure (GEX) Levels:
* $246.45: Highest positive NET GEX and CALL Resistance (Gamma Wall). If the price breaks above, expect bullish continuation.
* $245: Current price zone with balanced sentiment, acting as a pivot level.
* $242.5: Major support near the 3rd PUT Wall, indicating strong buyer interest at this level.
* $241: PUT Support and likely defensive zone if selling intensifies.
* $239: Secondary PUT Wall, representing a key defense point.
* Volume Profile:
* Point of Control (POC): Near $245.69, confirming this as a high-volume price level and significant short-term support.
Trade Scenarios:
Bullish Scenario:
* Entry: Above $246.50 (gamma resistance breakout).
* Target: $250 and $257.70.
* Stop-Loss: Below $245.
Bearish Scenario:
* Entry: Below $244.
* Target: $242 and $239.
* Stop-Loss: Above $246.50.
Directional Bias:
* The overall trend remains bullish within the ascending channel on the daily timeframe. However, watch for a breakout above $246.50 for confirmation of further upside. A failure to hold above $245 could lead to a short-term pullback toward $241.
Disclaimer:
This analysis is for educational purposes only and should not be taken as financial advice. Please conduct your own research and manage risk appropriately.
* Trend: GLD is trading within an ascending channel, with higher lows and higher highs forming a bullish structure. The price is approaching the upper resistance line near $257.71, indicating a potential test of this level.
* Support Levels:
* $245.86: Current price zone showing consolidation.
* $238.75: Key swing low, acting as a strong support level.
* $236.17: Major support to watch if a bearish breakdown occurs.
* Resistance Levels:
* $251.27: Intermediate resistance before testing the channel high.
* $257.71: Upper channel resistance.
* Indicators:
* MACD: The MACD is showing bullish momentum with a crossover above the signal line, indicating potential upward continuation.
* Volume: Increasing volume on bullish days suggests strong buyer interest.
30-Min Chart Analysis:
* Gamma Exposure (GEX) Levels:
* $246.45: Highest positive NET GEX and CALL Resistance (Gamma Wall). If the price breaks above, expect bullish continuation.
* $245: Current price zone with balanced sentiment, acting as a pivot level.
* $242.5: Major support near the 3rd PUT Wall, indicating strong buyer interest at this level.
* $241: PUT Support and likely defensive zone if selling intensifies.
* $239: Secondary PUT Wall, representing a key defense point.
* Volume Profile:
* Point of Control (POC): Near $245.69, confirming this as a high-volume price level and significant short-term support.
Trade Scenarios:
Bullish Scenario:
* Entry: Above $246.50 (gamma resistance breakout).
* Target: $250 and $257.70.
* Stop-Loss: Below $245.
Bearish Scenario:
* Entry: Below $244.
* Target: $242 and $239.
* Stop-Loss: Above $246.50.
Directional Bias:
* The overall trend remains bullish within the ascending channel on the daily timeframe. However, watch for a breakout above $246.50 for confirmation of further upside. A failure to hold above $245 could lead to a short-term pullback toward $241.
Disclaimer:
This analysis is for educational purposes only and should not be taken as financial advice. Please conduct your own research and manage risk appropriately.
Disclaimer
The information and publications are not meant to be, and do not constitute, financial, investment, trading, or other types of advice or recommendations supplied or endorsed by TradingView. Read more in the Terms of Use.
Disclaimer
The information and publications are not meant to be, and do not constitute, financial, investment, trading, or other types of advice or recommendations supplied or endorsed by TradingView. Read more in the Terms of Use.