GMAB at a Critical Confluence Zone – Potential Breakout or Reversal?
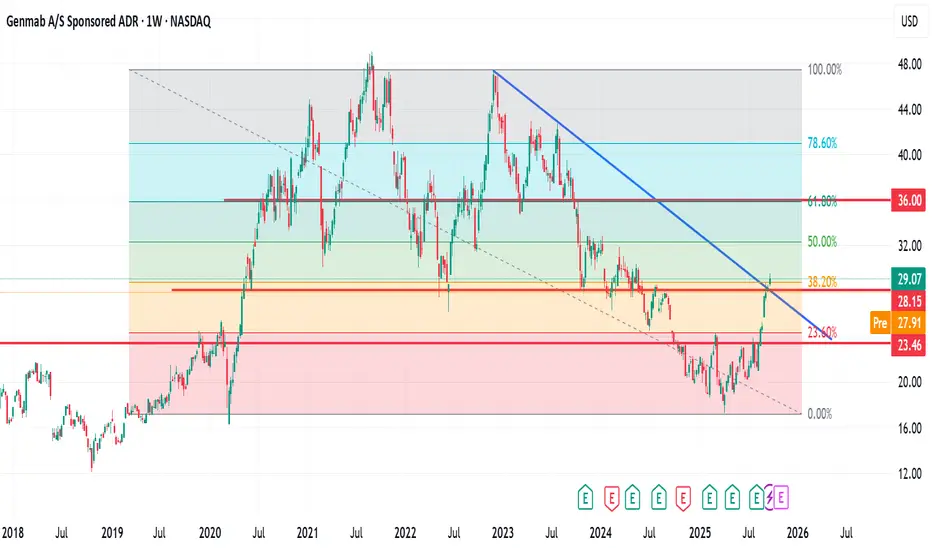
GMAB has shown strong recovery momentum since its April 7th, 2025, low. The price is currently testing a significant confluence area formed by a descending trendline and the Fib 38.2% support level.
If price action holds above this zone, there is potential for a continuation move toward the Fib 61.8% level, which would represent an estimated upside of around 28%.
My Trade Plan:
Initial entry at the current market cap.
Second entry after a confirmed breakout above this confluence zone.
As always, apply proper risk management—trade cautiously and according to your strategy.
🔹 Like, comment, and follow for more trade ideas.
🔹 Let’s connect here on TradingView.
Related publications
Disclaimer
The information and publications are not meant to be, and do not constitute, financial, investment, trading, or other types of advice or recommendations supplied or endorsed by TradingView. Read more in the Terms of Use.
Related publications
Disclaimer
The information and publications are not meant to be, and do not constitute, financial, investment, trading, or other types of advice or recommendations supplied or endorsed by TradingView. Read more in the Terms of Use.