🔶 Intermarket Analysis: Bitcoin / Gold / USD – Mid-2026 Projection
Macro Context
Based on a cross-asset analysis of BTC/USD, GOLD/USD, and the BTC/Gold ratio, we can identify a potential capital rotation phase between digital and tangible stores of value.
Currently:
• BTC/USD ≈ $110,900
• Gold/USD ≈ $4,200/oz
• BTC/Gold ≈ 26
I have projection that by mid-2026, BTC will trade around $75,000, and the BTC/Gold ratio will decline toward 16. This implies a significant relative strength shift from Bitcoin toward Gold.
⸻
1️⃣ BTC/USD Technical Structure
• The chart shows a strong uptrend support line from the 2020 low.
• Price recently rejected near the $120K all-time high, forming a local top.
• The confluence zone around $70–75K (previous resistance, now support) aligns with the potential pullback target — the orange ascending trendline confirms this zone.
• This area could represent the next accumulation base before any renewed bullish continuation toward $130–150K in the longer term.
→ Mid-term projection: retrace to 70–75K
→ long-term outlook: consolidation, followed by re-acceleration if liquidity improves.
⸻
2️⃣ BTC/Gold Ratio Analysis
• Currently at 26.3, this pair shows a clear descending momentum since the 2021 peak.
• The chart suggests a continuation toward the support band between 14–16, matching previous cycle lows.
• Historically, every test of this range coincided with a strong rebound in Gold and a temporary cooling phase in Bitcoin.
• The projected ratio decline from 26 → 16 indicates that Gold will outperform Bitcoin by roughly 40% in the same period.
⸻
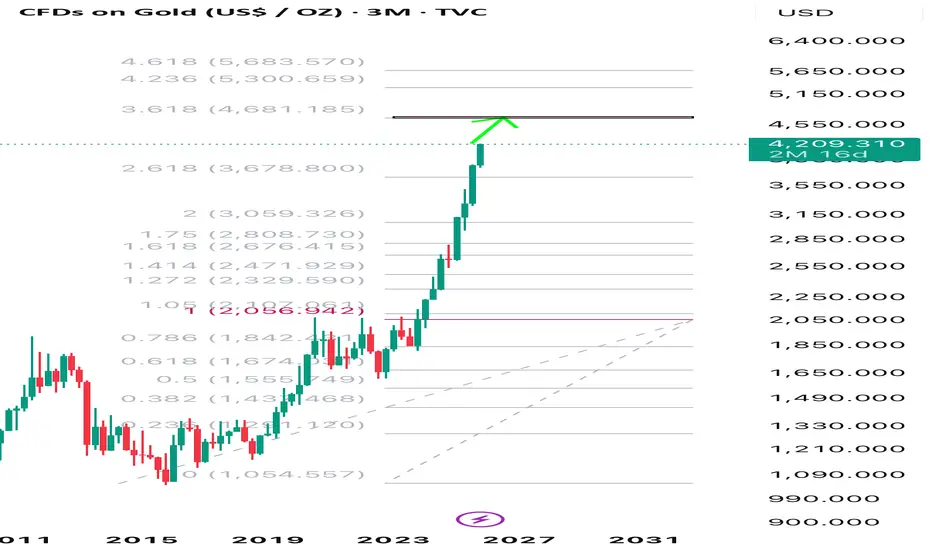
3️⃣ Gold/USD
• Gold recently broke out from its multi-year consolidation and is now trading around $4,200/oz, approaching the Fibonacci 3.618 extension near $4,680–$4,700.
• This technical level coincides with the implied fair value derived from the BTC/Gold ratio forecast:
Gold = BTC / (BTC/Gold) = 75,000 / 16 ≈ 4700$
In percentage terms:
• BTC may drop ≈ −31% from current levels.
• Gold may rise ≈ +12% nominally, potentially +15–18% when adjusted for continued USD devaluation.
→ Target zone: $4,680–$4,700/oz by mid-2026
→ Corresponds with Fibonacci 3.618 extension on the quarterly timeframe.
⸻
📊 Intermarket Conclusion
• The BTC/Gold ratio breakdown historically precedes reallocation toward safe assets.
• The forecast suggests a moderate BTC correction coupled with a gold appreciation, while the dollar continues its steady erosion in purchasing power.
• Gold may reach ~$4,700/oz, aligning perfectly with both Fibonacci and ratio-based projections.
• BTC remains in a long-term bull trend, but relative outperformance shifts temporarily toward Gold until new liquidity waves arrive.
Macro Context
Based on a cross-asset analysis of BTC/USD, GOLD/USD, and the BTC/Gold ratio, we can identify a potential capital rotation phase between digital and tangible stores of value.
Currently:
• BTC/USD ≈ $110,900
• Gold/USD ≈ $4,200/oz
• BTC/Gold ≈ 26
I have projection that by mid-2026, BTC will trade around $75,000, and the BTC/Gold ratio will decline toward 16. This implies a significant relative strength shift from Bitcoin toward Gold.
⸻
1️⃣ BTC/USD Technical Structure
• The chart shows a strong uptrend support line from the 2020 low.
• Price recently rejected near the $120K all-time high, forming a local top.
• The confluence zone around $70–75K (previous resistance, now support) aligns with the potential pullback target — the orange ascending trendline confirms this zone.
• This area could represent the next accumulation base before any renewed bullish continuation toward $130–150K in the longer term.
→ Mid-term projection: retrace to 70–75K
→ long-term outlook: consolidation, followed by re-acceleration if liquidity improves.
⸻
2️⃣ BTC/Gold Ratio Analysis
• Currently at 26.3, this pair shows a clear descending momentum since the 2021 peak.
• The chart suggests a continuation toward the support band between 14–16, matching previous cycle lows.
• Historically, every test of this range coincided with a strong rebound in Gold and a temporary cooling phase in Bitcoin.
• The projected ratio decline from 26 → 16 indicates that Gold will outperform Bitcoin by roughly 40% in the same period.
⸻
3️⃣ Gold/USD
• Gold recently broke out from its multi-year consolidation and is now trading around $4,200/oz, approaching the Fibonacci 3.618 extension near $4,680–$4,700.
• This technical level coincides with the implied fair value derived from the BTC/Gold ratio forecast:
Gold = BTC / (BTC/Gold) = 75,000 / 16 ≈ 4700$
In percentage terms:
• BTC may drop ≈ −31% from current levels.
• Gold may rise ≈ +12% nominally, potentially +15–18% when adjusted for continued USD devaluation.
→ Target zone: $4,680–$4,700/oz by mid-2026
→ Corresponds with Fibonacci 3.618 extension on the quarterly timeframe.
⸻
📊 Intermarket Conclusion
• The BTC/Gold ratio breakdown historically precedes reallocation toward safe assets.
• The forecast suggests a moderate BTC correction coupled with a gold appreciation, while the dollar continues its steady erosion in purchasing power.
• Gold may reach ~$4,700/oz, aligning perfectly with both Fibonacci and ratio-based projections.
• BTC remains in a long-term bull trend, but relative outperformance shifts temporarily toward Gold until new liquidity waves arrive.
Disclaimer
The information and publications are not meant to be, and do not constitute, financial, investment, trading, or other types of advice or recommendations supplied or endorsed by TradingView. Read more in the Terms of Use.
Disclaimer
The information and publications are not meant to be, and do not constitute, financial, investment, trading, or other types of advice or recommendations supplied or endorsed by TradingView. Read more in the Terms of Use.