Monthly timeframe (1M)
Gold historically spends 3–4 months in a consolidation or bounce range before continuing the macro trend.
After a parabolic move up, the current monthly candle shows a large top wick, signaling temporary buyer exhaustion – but the long-term trend remains firmly bullish.
Weekly timeframe (1W)
Price made a clean retest of the 20EMA, which is a textbook “healthy pullback” in strong uptrends.
RSI coming off the overbought zone with a mild bearish crossover.
CCI clearly trending down.
MACD showing the first signs of a potential rollover, but no confirmed bearish cross yet.
Overall: the weekly chart is in a bullish correction, not a reversal.
Daily timeframe (1D)
MACD is approaching the zero line, which rarely breaks below on gold during bullish cycles.
RSI near 50 – the typical lower boundary for bullish pullbacks.
CCI touched oversold once and looks ready for another retest.
Gold typically touches the 50EMA during corrections – which hasn’t happened yet.
Last daily candle closed above EMA20, but momentum is still weakening.
This strongly suggests a retest of the 3920–3950 zone (1D EMA50 area) before continuation.
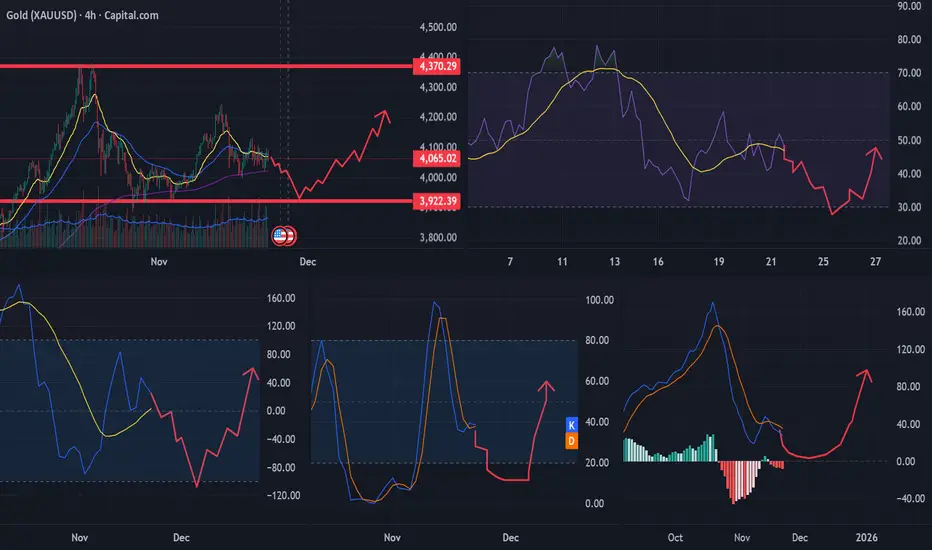
4H timeframe
Price is currently fighting with the 20EMA and 50EMA.
The 200EMA was tested twice and held perfectly, supported by oversold conditions across:
RSI, CCI, MACD curl, and Stoch.
This signals quiet institutional buying on dips.
Final outlook
Most probable scenario:
Retest of 3920–3950 (1D EMA50 zone)
Trend remains strong on higher timeframes; lower timeframes are completing a healthy correction.
Gold historically spends 3–4 months in a consolidation or bounce range before continuing the macro trend.
After a parabolic move up, the current monthly candle shows a large top wick, signaling temporary buyer exhaustion – but the long-term trend remains firmly bullish.
Weekly timeframe (1W)
Price made a clean retest of the 20EMA, which is a textbook “healthy pullback” in strong uptrends.
RSI coming off the overbought zone with a mild bearish crossover.
CCI clearly trending down.
MACD showing the first signs of a potential rollover, but no confirmed bearish cross yet.
Overall: the weekly chart is in a bullish correction, not a reversal.
Daily timeframe (1D)
MACD is approaching the zero line, which rarely breaks below on gold during bullish cycles.
RSI near 50 – the typical lower boundary for bullish pullbacks.
CCI touched oversold once and looks ready for another retest.
Gold typically touches the 50EMA during corrections – which hasn’t happened yet.
Last daily candle closed above EMA20, but momentum is still weakening.
This strongly suggests a retest of the 3920–3950 zone (1D EMA50 area) before continuation.
4H timeframe
Price is currently fighting with the 20EMA and 50EMA.
The 200EMA was tested twice and held perfectly, supported by oversold conditions across:
RSI, CCI, MACD curl, and Stoch.
This signals quiet institutional buying on dips.
Final outlook
Most probable scenario:
Retest of 3920–3950 (1D EMA50 zone)
Trend remains strong on higher timeframes; lower timeframes are completing a healthy correction.
Disclaimer
The information and publications are not meant to be, and do not constitute, financial, investment, trading, or other types of advice or recommendations supplied or endorsed by TradingView. Read more in the Terms of Use.
Disclaimer
The information and publications are not meant to be, and do not constitute, financial, investment, trading, or other types of advice or recommendations supplied or endorsed by TradingView. Read more in the Terms of Use.