🟡 GOLD (15-Min Chart) – Technical Analysis - EXPECTING SHARP FALL...
Observation:
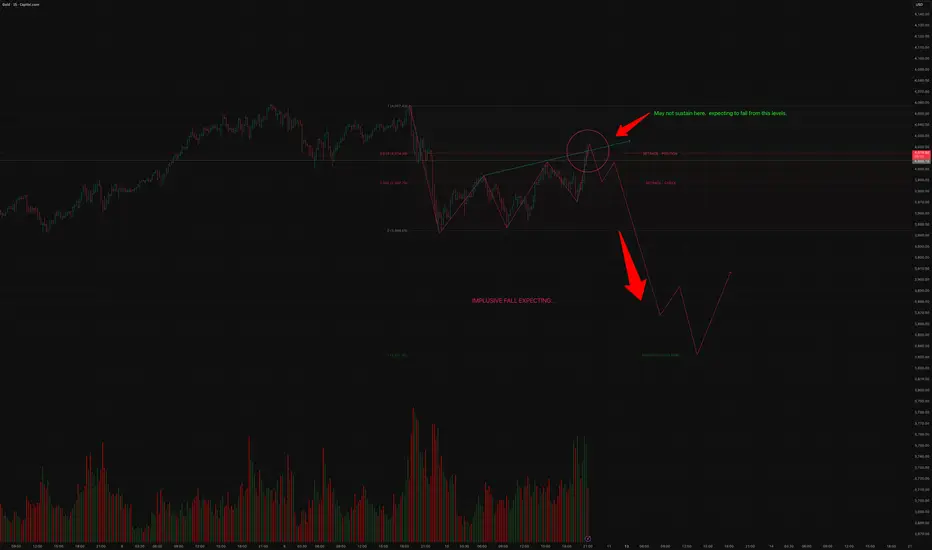
GOLD has retraced precisely to the 61.8% Fibonacci level, which is a classical retracement zone often associated with the end of a corrective rally within a broader downtrend.
The structure indicates that price faced resistance near the 4020–4030 zone, aligning with the Fibonacci 61.8% retracement of the prior impulse fall. The candlestick pattern and volume behavior suggest that this area is acting as a strong supply zone, where buyers are losing strength.
Price Action Expectation:
As highlighted in the chart, GOLD may not sustain above this 61.8% zone.
A breakdown below 3990 will likely trigger an impulsive fall, confirming the next leg of the downtrend.
The immediate target for this downside move is projected near 3850, derived from prior swing supports and Fibonacci extension confluence.
The projected wave structure also suggests a sharp decline followed by a minor pullback before stabilization around the 3850 zone.
Volume Confirmation:
Recent candles show declining buying volume at higher levels, reinforcing weakening bullish momentum. If volume spikes on a red candle below 3990, it will confirm a trend continuation toward the downside.
🔻 Key Levels
Zone Significance
4030–4040 61.8% retracement zone / strong resistance
3990 Breakdown confirmation level
3920 Intermediate support
3850 Target / expected short-term bottom
Bias: Bearish below 3990
Setup Type: Retracement rejection leading to impulsive fall
Confirmation Trigger: 15-min close below 3990 with rising volume
Target: 3850
Stop Loss: Above 4045
🧭 Conclusion
GOLD has completed a 61.8% retracement and is showing signs of exhaustion. If the price slips below 3990, an impulsive fall is likely to unfold toward 3850. Traders should watch for volume-supported breakdowns before confirming short positions.
⚠️ Disclaimer
This analysis is for educational and informational purposes only. It is not investment advice or a recommendation to trade. Markets involve risk, and past performance is not indicative of future results. Please use proper risk management and consult your financial advisor before making any trading decisions.
Observation:
GOLD has retraced precisely to the 61.8% Fibonacci level, which is a classical retracement zone often associated with the end of a corrective rally within a broader downtrend.
The structure indicates that price faced resistance near the 4020–4030 zone, aligning with the Fibonacci 61.8% retracement of the prior impulse fall. The candlestick pattern and volume behavior suggest that this area is acting as a strong supply zone, where buyers are losing strength.
Price Action Expectation:
As highlighted in the chart, GOLD may not sustain above this 61.8% zone.
A breakdown below 3990 will likely trigger an impulsive fall, confirming the next leg of the downtrend.
The immediate target for this downside move is projected near 3850, derived from prior swing supports and Fibonacci extension confluence.
The projected wave structure also suggests a sharp decline followed by a minor pullback before stabilization around the 3850 zone.
Volume Confirmation:
Recent candles show declining buying volume at higher levels, reinforcing weakening bullish momentum. If volume spikes on a red candle below 3990, it will confirm a trend continuation toward the downside.
🔻 Key Levels
Zone Significance
4030–4040 61.8% retracement zone / strong resistance
3990 Breakdown confirmation level
3920 Intermediate support
3850 Target / expected short-term bottom
Bias: Bearish below 3990
Setup Type: Retracement rejection leading to impulsive fall
Confirmation Trigger: 15-min close below 3990 with rising volume
Target: 3850
Stop Loss: Above 4045
🧭 Conclusion
GOLD has completed a 61.8% retracement and is showing signs of exhaustion. If the price slips below 3990, an impulsive fall is likely to unfold toward 3850. Traders should watch for volume-supported breakdowns before confirming short positions.
⚠️ Disclaimer
This analysis is for educational and informational purposes only. It is not investment advice or a recommendation to trade. Markets involve risk, and past performance is not indicative of future results. Please use proper risk management and consult your financial advisor before making any trading decisions.
Disclaimer
The information and publications are not meant to be, and do not constitute, financial, investment, trading, or other types of advice or recommendations supplied or endorsed by TradingView. Read more in the Terms of Use.
Disclaimer
The information and publications are not meant to be, and do not constitute, financial, investment, trading, or other types of advice or recommendations supplied or endorsed by TradingView. Read more in the Terms of Use.