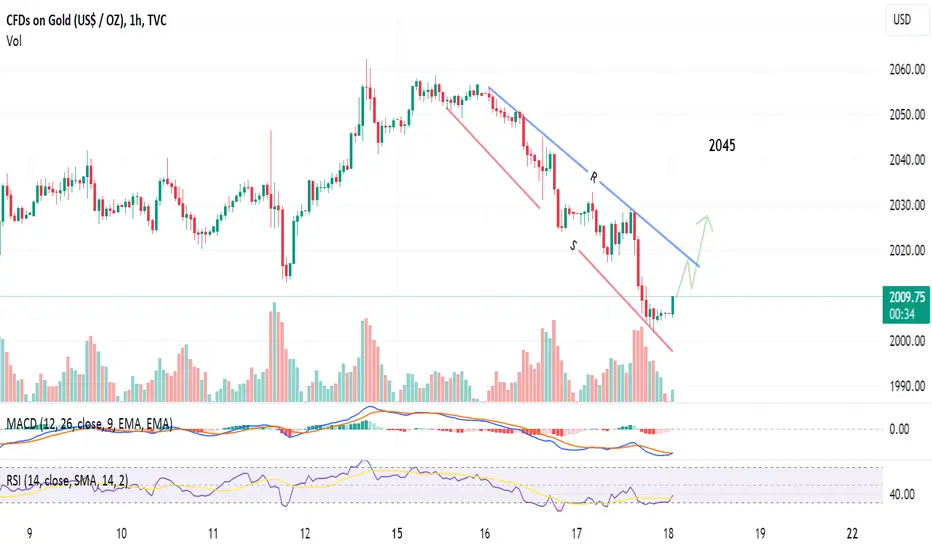
1-hour chart, GOLD is trading in a falling expanding triangle; and is expected to test the resistance at around 2018. After crossing Resistance line (blue), the target will be 2045
Both technical indicators RSI and MACD are positive - supporting this view.
Both technical indicators RSI and MACD are positive - supporting this view.
Trade active
Trade active
Potential for more upside movement..Disclaimer
The information and publications are not meant to be, and do not constitute, financial, investment, trading, or other types of advice or recommendations supplied or endorsed by TradingView. Read more in the Terms of Use.
Disclaimer
The information and publications are not meant to be, and do not constitute, financial, investment, trading, or other types of advice or recommendations supplied or endorsed by TradingView. Read more in the Terms of Use.