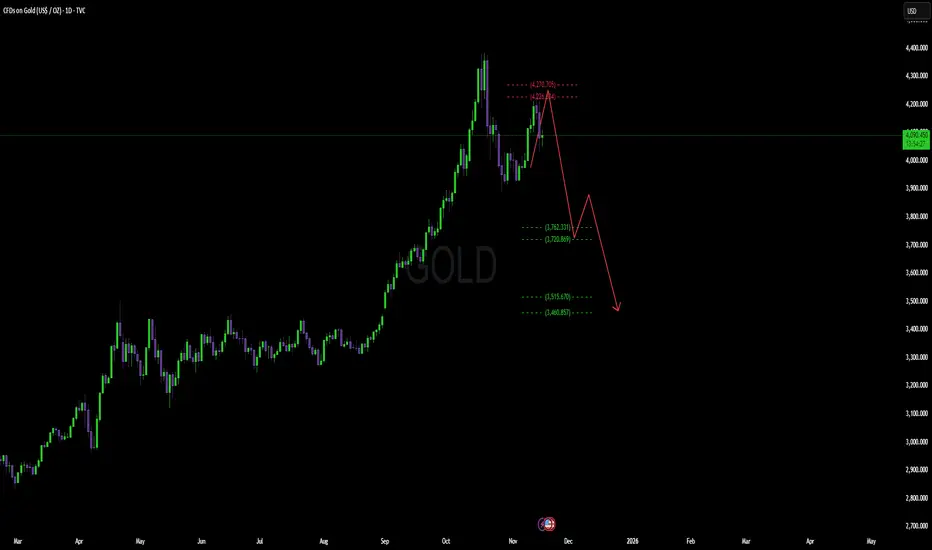
Gold is showing signs of exhaustion near the recent highs around $4,226 – $4,270.
If price fails to break above this zone, a deeper correction becomes likely.
🔽 Key Downside Levels:
• $3,762 – $3,720 (first reaction zone)
• $3,515 – $3,460 (major support zone)
The structure suggests a potential lower-high formation, followed by a continuation to the downside — unless gold can reclaim and hold above the highlighted resistance area.
Scenario I’m watching:
Rejection → Drop toward $3,720 → Short bounce → Continuation into deeper support.
Not financial advice — just sharing my chart.
Disclaimer
The information and publications are not meant to be, and do not constitute, financial, investment, trading, or other types of advice or recommendations supplied or endorsed by TradingView. Read more in the Terms of Use.
Disclaimer
The information and publications are not meant to be, and do not constitute, financial, investment, trading, or other types of advice or recommendations supplied or endorsed by TradingView. Read more in the Terms of Use.