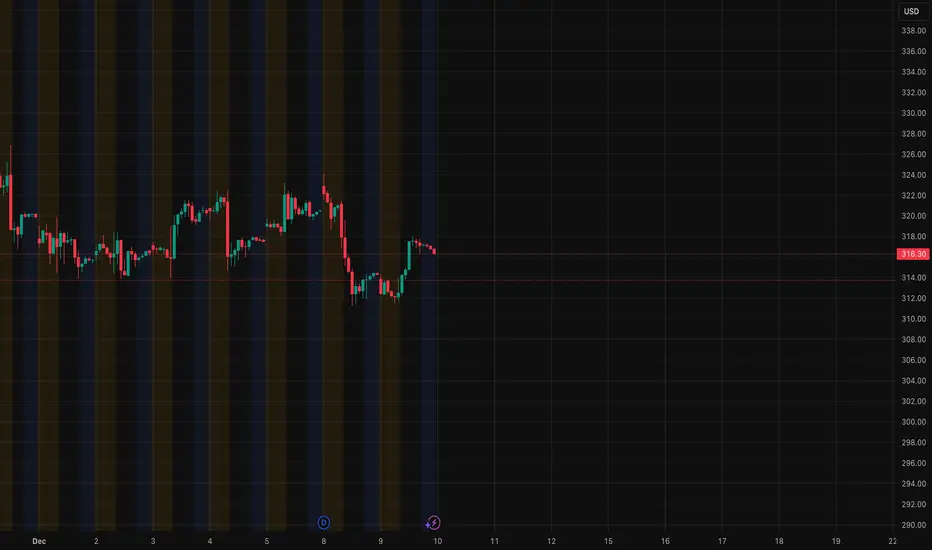
GOOGL continues to respect one of the most important levels on its chart: the 311–312 zone. Every time price dips into this area, it gets absorbed instantly, creating a solid base for the recent recovery. That kind of repeated defense usually means real buyers are sitting there, not just random bounces.
The move back toward 316–318 shows where supply still lives. Price wasn’t able to push through that pocket, and the rejection lined up perfectly with the upper trendline on the 1-hour chart. It doesn’t break the bullish structure, but it does tell us that sellers remain active and patient at that level.

On the 15-minute timeframe, the picture is cleaner. GOOGL had a strong run off the 311 support, pushed straight into 318, and then shifted into a controlled pullback. EMAs are flattening, which usually means the market is transitioning from momentum into consolidation. The structure stays constructive as long as price avoids making a new lower low. That 311–312 zone is the line in the sand.

The gamma exposure map adds clarity to why the stock keeps behaving this way. The put wall is stacked right at 311–312, which means dealers hedge by buying each time price approaches it — creating that reliable support. On the other side, the first meaningful call-wall pressure sits at 316–318. That’s exactly where price keeps getting rejected, because dealer hedging tends to produce sell-side flow as we approach those levels.
This leaves GOOGL pinned between two strong forces: a supportive floor and a heavy ceiling. Until one of those gives way, the stock is likely to keep drifting around the middle of the range, roughly near 315. A clean breakout over 318 would free it toward 322–325, where the next gamma pockets sit. A breakdown under 312, on the other hand, would open room toward 310 and possibly even 300 if momentum shifts.
Right now the chart and the options-based gamma structure are aligned, and that usually produces reliable levels. GOOGL is coiling — and whichever side breaks first will define the next directional leg.
Disclaimer: This analysis is for educational purposes only and is not financial advice. Always do your own research and manage your risk.
The move back toward 316–318 shows where supply still lives. Price wasn’t able to push through that pocket, and the rejection lined up perfectly with the upper trendline on the 1-hour chart. It doesn’t break the bullish structure, but it does tell us that sellers remain active and patient at that level.
On the 15-minute timeframe, the picture is cleaner. GOOGL had a strong run off the 311 support, pushed straight into 318, and then shifted into a controlled pullback. EMAs are flattening, which usually means the market is transitioning from momentum into consolidation. The structure stays constructive as long as price avoids making a new lower low. That 311–312 zone is the line in the sand.
The gamma exposure map adds clarity to why the stock keeps behaving this way. The put wall is stacked right at 311–312, which means dealers hedge by buying each time price approaches it — creating that reliable support. On the other side, the first meaningful call-wall pressure sits at 316–318. That’s exactly where price keeps getting rejected, because dealer hedging tends to produce sell-side flow as we approach those levels.
This leaves GOOGL pinned between two strong forces: a supportive floor and a heavy ceiling. Until one of those gives way, the stock is likely to keep drifting around the middle of the range, roughly near 315. A clean breakout over 318 would free it toward 322–325, where the next gamma pockets sit. A breakdown under 312, on the other hand, would open room toward 310 and possibly even 300 if momentum shifts.
Right now the chart and the options-based gamma structure are aligned, and that usually produces reliable levels. GOOGL is coiling — and whichever side breaks first will define the next directional leg.
Disclaimer: This analysis is for educational purposes only and is not financial advice. Always do your own research and manage your risk.
Disclaimer
The information and publications are not meant to be, and do not constitute, financial, investment, trading, or other types of advice or recommendations supplied or endorsed by TradingView. Read more in the Terms of Use.
Disclaimer
The information and publications are not meant to be, and do not constitute, financial, investment, trading, or other types of advice or recommendations supplied or endorsed by TradingView. Read more in the Terms of Use.