GOOGL Weekly Outlook (Oct 28–31): “Google Reclaims the Trend — Can It Hold Above $270?” 🔍
1. Weekly (1W) Structure – Macro Strength Reaffirmed
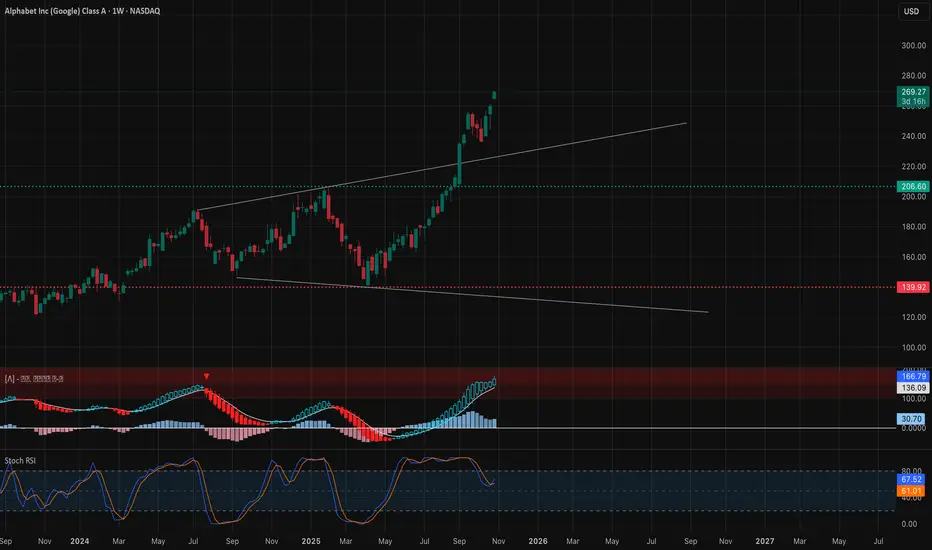
Alphabet’s weekly structure shows a textbook bullish continuation following a confirmed Break of Structure (BOS) above $207. After a brief Change of Character (CHoCH) pullback toward the $145–$150 demand zone, GOOGL reaccelerated upward, reclaiming control of the ascending channel. The move toward $270 marks a decisive momentum comeback with potential to stretch toward $285–$290 if buyers sustain pressure.
* Bias: Bullish continuation
* Support: $207 → $254
* Resistance: $270 → $285
* MACD: Clean bullish expansion — momentum firmly in buyer hands.
* Stochastic RSI: Hovering near overbought, but trending, not topping — indicative of sustained buying momentum.
💡 Weekly Thought: As long as GOOGL stays above $254, the broader uptrend remains intact. Macro structure suggests strength continuation into November unless a deep profit-taking correction forms below $250.
2. Daily (1D) – Reclaiming Momentum Zone

Daily chart confirms multiple BOS and CHoCH rotations forming a staircase pattern of higher lows and higher highs. The breakout above $260 confirms a new impulse leg inside the mid-channel zone. Buyers reclaimed $256–$259, an area that previously acted as supply — now flipped into a solid demand base.
* Bias: Bullish trend continuation
* Support: $256 → $240
* Resistance: $270 → $280
* Indicators:
* MACD rebounded into positive territory — bullish crossover confirmed.
* Stochastic RSI climbing from midrange — confirming short-term buying pressure.
💭 Daily Suggestion: Buyers can look for dip entries near $262–$264 early week. A sustained close above $270 may trigger acceleration toward $280–$285 as gamma and volume momentum expand.
3. 1-Hour (1H) – Intraday Precision Map

GOOGL’s 1-hour chart shows near-perfect alignment with higher timeframes. A clean BOS structure sequence forms above $259 and $265, with the price consolidating near $270 — a key resistance-turned-potential breakout pivot. The current slope of the ascending trendline supports a healthy, controlled climb.
* Scalp Bias: Bullish above $262
* Resistance: $272 → $280
* Support: $259 → $249
* Setup Idea:
* Call scalp: Above $270 breakout; target $275–$280.
* Put scalp: Only if price falls below $259 with volume, target $250.
📈 1H Thought: Intraday traders should monitor price behavior at $270 — this zone is both a psychological and gamma-based resistance. A breakout with strong volume could ignite an extended move to $280 quickly.
4. GEX & Options Sentiment – Institutional Positioning

Gamma Exposure (GEX) reveals a strong call-dominant structure, with layered resistance near $270–$280 — key short-term gamma magnets.
* Highest positive GEX / resistance: $270 → $275 → $280
* Support (put walls): $250 → $242 → $235
* Call bias: +35.8% (bullish skew)
* IVR: 46.6 (moderately elevated)
* IVx avg: 49.8 (slightly declining → supportive of upside expansion)
Institutions appear positioned to defend $255–$260, while higher strikes near $275 are drawing increasing call exposure. Gamma compression could trigger a grind higher if $270 holds.
5. Suggested Option Plays
* Bullish Setup (Preferred):
* Buy-to-open 270C–275C (1DTE/2DTE) on confirmed hold above $270.
* Target: $280
* Stop: Below $259
* Reason: Strong structural breakout confluence with call gamma reinforcement.
* Bearish Hedge (Cautious):
* Buy 250P (1DTE/2DTE) only if breakdown below $259 with volume confirmation.
* Target: $242
* Stop: Above $265
GOOGL is showing a consistent bullish structure across all timeframes — higher lows, continued BOS patterns, and strong gamma buildup supporting continuation. Price action above $270 can trigger a swift advance toward $280 before potential consolidation.
🎯 Primary Bias: Bullish toward $280–$285 ⚠️ Watch For: Failure to hold $259 = momentum loss or short-term correction signal.
This analysis is for educational purposes only and does not constitute financial advice. Always do your own research and manage your risk before trading.
1. Weekly (1W) Structure – Macro Strength Reaffirmed
Alphabet’s weekly structure shows a textbook bullish continuation following a confirmed Break of Structure (BOS) above $207. After a brief Change of Character (CHoCH) pullback toward the $145–$150 demand zone, GOOGL reaccelerated upward, reclaiming control of the ascending channel. The move toward $270 marks a decisive momentum comeback with potential to stretch toward $285–$290 if buyers sustain pressure.
* Bias: Bullish continuation
* Support: $207 → $254
* Resistance: $270 → $285
* MACD: Clean bullish expansion — momentum firmly in buyer hands.
* Stochastic RSI: Hovering near overbought, but trending, not topping — indicative of sustained buying momentum.
💡 Weekly Thought: As long as GOOGL stays above $254, the broader uptrend remains intact. Macro structure suggests strength continuation into November unless a deep profit-taking correction forms below $250.
2. Daily (1D) – Reclaiming Momentum Zone
Daily chart confirms multiple BOS and CHoCH rotations forming a staircase pattern of higher lows and higher highs. The breakout above $260 confirms a new impulse leg inside the mid-channel zone. Buyers reclaimed $256–$259, an area that previously acted as supply — now flipped into a solid demand base.
* Bias: Bullish trend continuation
* Support: $256 → $240
* Resistance: $270 → $280
* Indicators:
* MACD rebounded into positive territory — bullish crossover confirmed.
* Stochastic RSI climbing from midrange — confirming short-term buying pressure.
💭 Daily Suggestion: Buyers can look for dip entries near $262–$264 early week. A sustained close above $270 may trigger acceleration toward $280–$285 as gamma and volume momentum expand.
3. 1-Hour (1H) – Intraday Precision Map
GOOGL’s 1-hour chart shows near-perfect alignment with higher timeframes. A clean BOS structure sequence forms above $259 and $265, with the price consolidating near $270 — a key resistance-turned-potential breakout pivot. The current slope of the ascending trendline supports a healthy, controlled climb.
* Scalp Bias: Bullish above $262
* Resistance: $272 → $280
* Support: $259 → $249
* Setup Idea:
* Call scalp: Above $270 breakout; target $275–$280.
* Put scalp: Only if price falls below $259 with volume, target $250.
📈 1H Thought: Intraday traders should monitor price behavior at $270 — this zone is both a psychological and gamma-based resistance. A breakout with strong volume could ignite an extended move to $280 quickly.
4. GEX & Options Sentiment – Institutional Positioning
Gamma Exposure (GEX) reveals a strong call-dominant structure, with layered resistance near $270–$280 — key short-term gamma magnets.
* Highest positive GEX / resistance: $270 → $275 → $280
* Support (put walls): $250 → $242 → $235
* Call bias: +35.8% (bullish skew)
* IVR: 46.6 (moderately elevated)
* IVx avg: 49.8 (slightly declining → supportive of upside expansion)
Institutions appear positioned to defend $255–$260, while higher strikes near $275 are drawing increasing call exposure. Gamma compression could trigger a grind higher if $270 holds.
5. Suggested Option Plays
* Bullish Setup (Preferred):
* Buy-to-open 270C–275C (1DTE/2DTE) on confirmed hold above $270.
* Target: $280
* Stop: Below $259
* Reason: Strong structural breakout confluence with call gamma reinforcement.
* Bearish Hedge (Cautious):
* Buy 250P (1DTE/2DTE) only if breakdown below $259 with volume confirmation.
* Target: $242
* Stop: Above $265
GOOGL is showing a consistent bullish structure across all timeframes — higher lows, continued BOS patterns, and strong gamma buildup supporting continuation. Price action above $270 can trigger a swift advance toward $280 before potential consolidation.
🎯 Primary Bias: Bullish toward $280–$285 ⚠️ Watch For: Failure to hold $259 = momentum loss or short-term correction signal.
This analysis is for educational purposes only and does not constitute financial advice. Always do your own research and manage your risk before trading.
Disclaimer
The information and publications are not meant to be, and do not constitute, financial, investment, trading, or other types of advice or recommendations supplied or endorsed by TradingView. Read more in the Terms of Use.
Disclaimer
The information and publications are not meant to be, and do not constitute, financial, investment, trading, or other types of advice or recommendations supplied or endorsed by TradingView. Read more in the Terms of Use.