Goldman is a classic in more ways than one - long at 716.00
The 716.00 was a pre-market trade, btw. Goldman benefits whenever the rich benefit, and if there's one thing I'm sure of in the next several years, it's that the rich in America will outperform everyone else financially. But this isn't just a play on macro, government related, targeted largesse. I think Goldman's chart is in a good spot here.
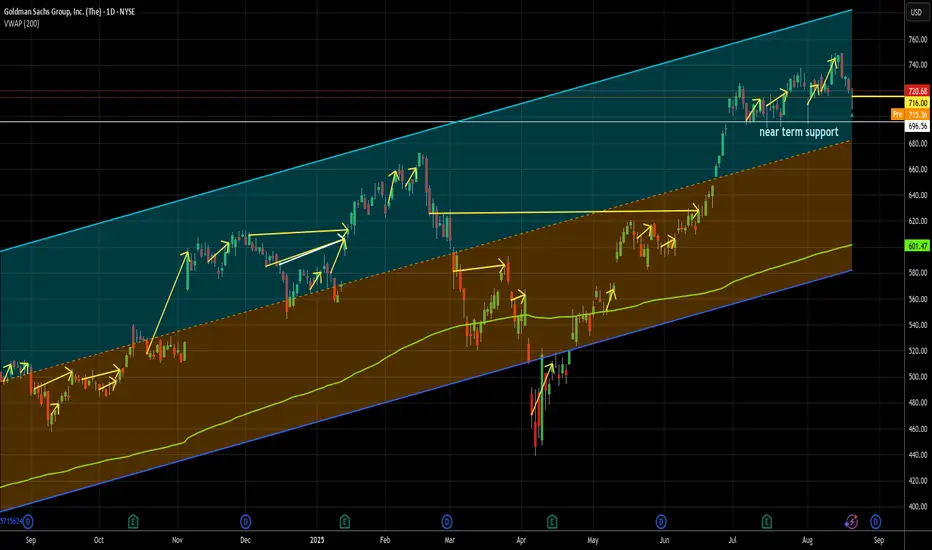
The market feels weak here, but the GS chart is very solid. It's well above its 200d VWAP, still in a solid uptrend and in the top half of its 1Y regression channel, indicating (at least at this point) it is correcting, not collapsing. It has support fairly close by as well from its early July lows and beyond that, from the Feb 18 high.
As everyone knows, though, I rely on my data as the primary decision-making force in my trades and GS is pretty exceptional. Over the long haul, and over the past year shown here, GS has solidly outperformed most large caps and outperformed SPY by a mile in what has been a solidly above average year for the index.
24 buy signals have all resulted in profitable moves, 24-0 with an average gain of 2.96% in just under 11 trading days. That's 27bp per day held. For comparison, SPY's long term daily average is around 4bp/day and this year, while up about 14%, it has been about 5.6bp/day. So we are looking at a trade that has been, on average, about 5x the SPY daily return this year.
But that's not really fair to GS. Of its 24 signals, the median (middle) performer was 57bp/day, meaning half the trades 10x'd the daily market return. Also, only 2 of the 24 underperformed the daily return of SPY this year. Even if you throw out its best signal, a 15% in 12 days earning-related thumper, and leave in the tariff-tantrum related long, unproductive trade from early this year, average return is still 4x SPY on a daily average return basis.
We shall see. We COULD be on the cusp of the beginning of a strong market pullback, or we could just be in a short-term corrective blip. Either way, I think GS leads the pack performance-wise. And just a general tip, when the market is weak, I turn to trading large cap stalwarts that have weathered all the previous storms. Their returns may not be as sexy as meme stocks, but I can be sure they'll still be around later, and if they are, I'll make money.
Oh yeah by the way, in a world where everyone is gnashing their teeth about valuations, it has a P/E under 16.
As always - this is intended as "edutainment" and my perspective on what I am or would be doing, not a recommendation for you to buy or sell. Act accordingly and invest at your own risk. DYOR and only make investments that make good financial sense for you in your current situation.
Trade closed: target reached
Closed this one today at 741.69 at the close. I wanted to let it run, but I don't like holding over weekends when I don't have to. It gained 3.62% in 2 trading days and was just shy of 3x the return of SPY over those 2 days - that's plenty for me. I'm not greedy. Plenty of other stocks to trade. Today was a banger day for most of us, I suspect, so have a good weekend everyone!Note
Trade results for my recordsWins 1 Losses 0
Avg gain per lot = +3.62%
Avg holding periods per lot = 2 trading days
Avg gain per lot per day held = +1.81%
Annualize RoR = 1.81% x 252 = +456%
Disclaimer
The information and publications are not meant to be, and do not constitute, financial, investment, trading, or other types of advice or recommendations supplied or endorsed by TradingView. Read more in the Terms of Use.
Disclaimer
The information and publications are not meant to be, and do not constitute, financial, investment, trading, or other types of advice or recommendations supplied or endorsed by TradingView. Read more in the Terms of Use.