Hello everyone!
From previous update, HSI uptrend mode continue on track.
At point of writing ✍️:
The HSI hit and break 4-year peak 27058 (the next target to break 5-year peak at 31,181 at 2021; do you think is possible?)
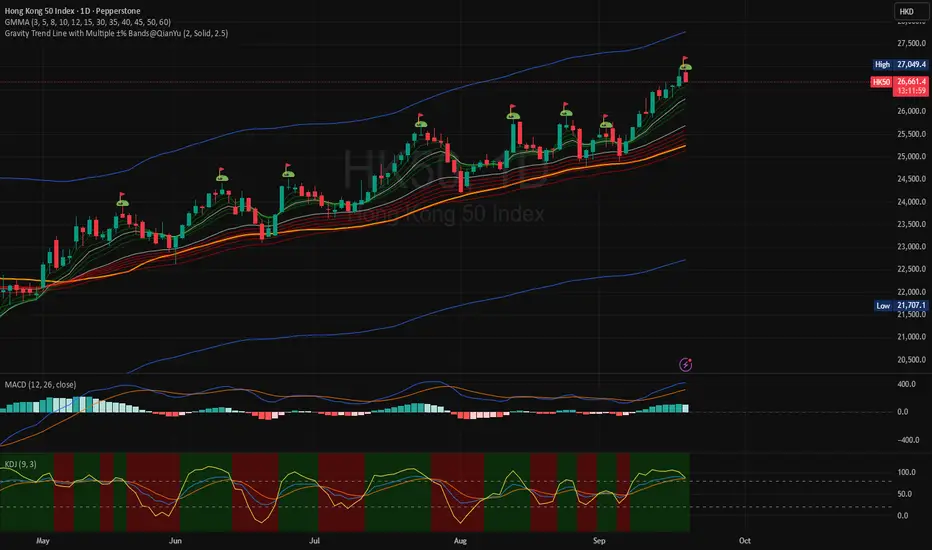
 HK50 This morning hit 27049
What's your take with the recent fed rate cut and the news?
** Following the overnight U.S. Federal Reserve's 25-basis-point interest rate cut, China's central bank left a key rate unchanged on Thursday, as authorities appear in no rush to ease monetary settings.
** Hong Kong's central bank lowered its base rate charged via the overnight discount window by 25 bps to 4.50%, tracking the Fed move.
** The benchmark Hang Seng index
HSI surpassed the 27,000 mark for the first time since July 2021, before edging down 0.18% by midday.
tradingview.com/news/reuters.com,2025:newsml_L3N3V503R:0-semiconductor-rally-lifts-china-stocks-to-10-year-high/
Trade as usual. Manage your risk/reward. Be patient.
For 4H - it seems gonna to take a pause; to retrace back before to charge up again to next Hi.
🗝️ 26730, 26450
If so that's the golden zone to take a bold slightly aggressive position ride the trend to break 27320 (then 27660)
MACD Signal above zero level
KDJ is above 80 and curving down a retracement is inevitable.
currently on D ChartHK50
🗝️ Resistance Level : 27050
Support Level : 26585
Support level 26300 (EMA30)
If break below, huge retracement from current level to 25300.
🗝️ Strong Support Level : 25250 (from 24767 @28Aug25, Gravity TrendLine support lifting circa 484pts).
Uptrend is intact.
Notice the trend, after the ⛳ , it always retrace back to GravityTrend Line area,
GMMA squeezing again (around 4,5 Sep 25 from the previous squeeze 27,28Aug25) before it spreading out again to rise again.
Well it's quite predictable the movement of the Index like 🌊 it's completing its cycle for the next wave to form; it maybe a ripple and it maybe a huge wave.
This could apply on shorter timeframe for your position on swing or intraday trade.
It's not a rocket science just a little patient and contemplation is suffice.
Following your own tradeplan/SOP.
Take your position, setting stop loss and ride on the trend (up/down).
At point of writing ✍️
Be aware that Index is about to being attracted towards to D GravityTrendLine likely tomorrow and next week.

However, the uptrend is very much intact and steady (W chart - see above) - the rippling 🌊 last longer, this seems mirroring how the Index hovering above 10% GravityTrend Line back in 2017, guess the party🕺💃is still on.
🗝️ Next Resistance Level : 25300
🗝️ Next Support Level : 24970
🗝️ Strong Support Level : 24920 (EMA30)
When in doubt, sit. Not every candle needs a response.
— Sometimes, the wise action is non-action, you always have options with wise discernment.
From previous update, HSI uptrend mode continue on track.
At point of writing ✍️:
The HSI hit and break 4-year peak 27058 (the next target to break 5-year peak at 31,181 at 2021; do you think is possible?)
What's your take with the recent fed rate cut and the news?
** Following the overnight U.S. Federal Reserve's 25-basis-point interest rate cut, China's central bank left a key rate unchanged on Thursday, as authorities appear in no rush to ease monetary settings.
** Hong Kong's central bank lowered its base rate charged via the overnight discount window by 25 bps to 4.50%, tracking the Fed move.
** The benchmark Hang Seng index
HSI surpassed the 27,000 mark for the first time since July 2021, before edging down 0.18% by midday.
tradingview.com/news/reuters.com,2025:newsml_L3N3V503R:0-semiconductor-rally-lifts-china-stocks-to-10-year-high/
Trade as usual. Manage your risk/reward. Be patient.
For 4H - it seems gonna to take a pause; to retrace back before to charge up again to next Hi.
🗝️ 26730, 26450
If so that's the golden zone to take a bold slightly aggressive position ride the trend to break 27320 (then 27660)
MACD Signal above zero level
KDJ is above 80 and curving down a retracement is inevitable.
currently on D Chart
🗝️ Resistance Level : 27050
Support Level : 26585
Support level 26300 (EMA30)
If break below, huge retracement from current level to 25300.
🗝️ Strong Support Level : 25250 (from 24767 @28Aug25, Gravity TrendLine support lifting circa 484pts).
Uptrend is intact.
Notice the trend, after the ⛳ , it always retrace back to GravityTrend Line area,
GMMA squeezing again (around 4,5 Sep 25 from the previous squeeze 27,28Aug25) before it spreading out again to rise again.
Well it's quite predictable the movement of the Index like 🌊 it's completing its cycle for the next wave to form; it maybe a ripple and it maybe a huge wave.
This could apply on shorter timeframe for your position on swing or intraday trade.
It's not a rocket science just a little patient and contemplation is suffice.
Following your own tradeplan/SOP.
Take your position, setting stop loss and ride on the trend (up/down).
At point of writing ✍️
Be aware that Index is about to being attracted towards to D GravityTrendLine likely tomorrow and next week.
However, the uptrend is very much intact and steady (W chart - see above) - the rippling 🌊 last longer, this seems mirroring how the Index hovering above 10% GravityTrend Line back in 2017, guess the party🕺💃is still on.
🗝️ Next Resistance Level : 25300
🗝️ Next Support Level : 24970
🗝️ Strong Support Level : 24920 (EMA30)
When in doubt, sit. Not every candle needs a response.
— Sometimes, the wise action is non-action, you always have options with wise discernment.
Related publications
Disclaimer
The information and publications are not meant to be, and do not constitute, financial, investment, trading, or other types of advice or recommendations supplied or endorsed by TradingView. Read more in the Terms of Use.
Related publications
Disclaimer
The information and publications are not meant to be, and do not constitute, financial, investment, trading, or other types of advice or recommendations supplied or endorsed by TradingView. Read more in the Terms of Use.