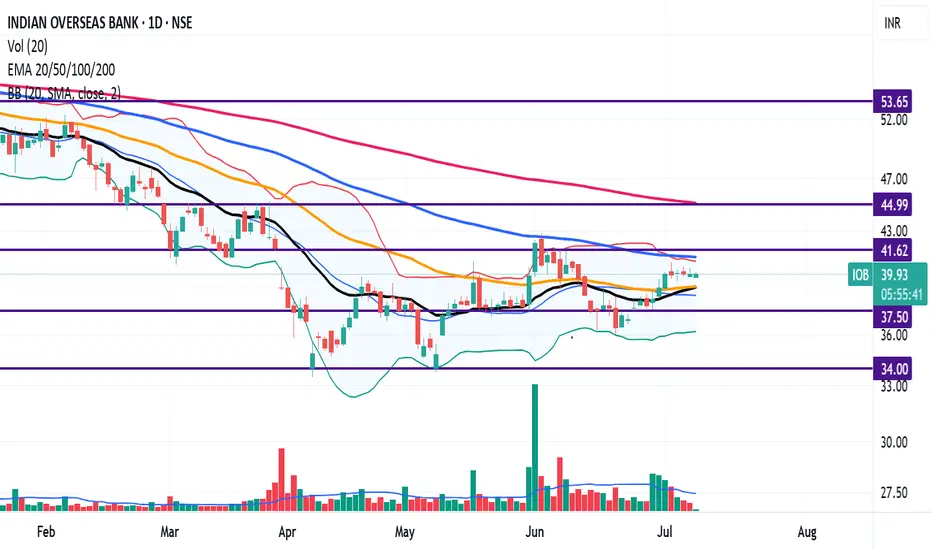
IOB is taking strong support around 20 EMA (Black Line),
We can confirm the bullish trend in the stock when 20 EMA (Black Line) cross above 50 EMA (Orange Line) decisively in the weekly chart.
IOB is 44.86% away from 52 week high and
19.49% away from 52 week low
The stocks is showing Mid Range Momentum when compared to Short, Medium and Long Term Moving Averages
Resistance levels: 41.6, 45, 54
Support levels: 37.5, 34
Disclaimer
The information and publications are not meant to be, and do not constitute, financial, investment, trading, or other types of advice or recommendations supplied or endorsed by TradingView. Read more in the Terms of Use.
Disclaimer
The information and publications are not meant to be, and do not constitute, financial, investment, trading, or other types of advice or recommendations supplied or endorsed by TradingView. Read more in the Terms of Use.