Good Morning,
Many of us have come across cautionary stories on Reddit trading groups. A common theme among these stories is that the traders involved never mastered the art of naked trading, or they overlooked its importance entirely.
Personally, I have two layouts saved on my TradingView account—one for my overall trading strategy and another specifically called "naked trading." I use both layouts simultaneously, appreciating and embracing the mental challenge that each approach provides.
Always remember your limits and never trade more than you are comfortable risking. Establish a stop-loss level that aligns with your strategy and risk tolerance; for me, it’s 7%, which I consider my lucky number. Knowing when to exit a trade is crucial. In day trading, my exit can range from 2% to 50%, depending on the stock's volatility. Swing trades typically have a maximum exit of around 25%, while position trades are more flexible, allowing me to exit when reversal patterns appear.
The core trading strategies are similar across all three types, but the key difference lies in your ability to process information quickly and how fast that category requires action.
For example:
Day Trading: Requires rapid analysis and decision-making, as market conditions change within minutes. If you lack quick critical thinking skills, day trading may not be suitable for you.
Swing Trading: Offers more leeway, with hours to days to analyze and act on market movements.
Position Trading: The most forgiving, providing days or even weeks to evaluate information and make decisions.
My investment portfolio incorporates a combination of strategies, with an allocation of 50% in position trading, 35% in swing trading, and 15% in day trading. I find value in each strategy and have benefited from mastering them collectively. It is crucial for anyone stepping into trading to grasp that the essence of trading lies in analyzing price action and assessing risks effectively. Success requires a deep understanding of both these elements.
Reflecting on my 15-year trading journey, I initially focused on discovering new strategies and shortcuts to enhance my trading performance, often overlooking the fundamental aspects of trading. Prior to utilizing any trading indicators, it is advisable for traders to thoroughly understand price action and its underlying mechanisms. A strong grasp of basic supply and demand principles is indispensable.
I have achieved considerable success in trading, often outperforming market conditions that challenge many. My success stems from refining and consistently adhering to my strategies, with a particular emphasis on interpreting price action from charts.
Price action is a fundamental concept in technical analysis that involves making trading decisions based on the historical price movements of an asset, without relying heavily on technical indicators. Here is an informative summary on how to use price action in technical analysis:
Understanding Price Patterns: Familiarize yourself with common price patterns, such as double tops and bottoms, head and shoulders, and flag patterns. These patterns can provide insights into potential trend reversals or continuations.
Identifying Support and Resistance Levels: Determine key support and resistance levels on a price chart. Support levels are where the price tends to stop falling, and resistance levels are where the price tends to stop rising. These levels can act as decision points for entering or exiting trades.
Analyzing Candlestick Patterns: Study candlestick charts to identify patterns like engulfing patterns, dojis, and hammers. Candlestick patterns can indicate market sentiment and potential price direction changes.
Evaluating Trend Lines: Draw trend lines by connecting the highs or lows on a price chart. Trend lines can help identify the direction of the market and potential breakout points.
Observing Market Structure: Pay attention to the overall market structure, including trend directions (uptrend, downtrend, sideways) and cycle phases (accumulation, markup, distribution, markdown).
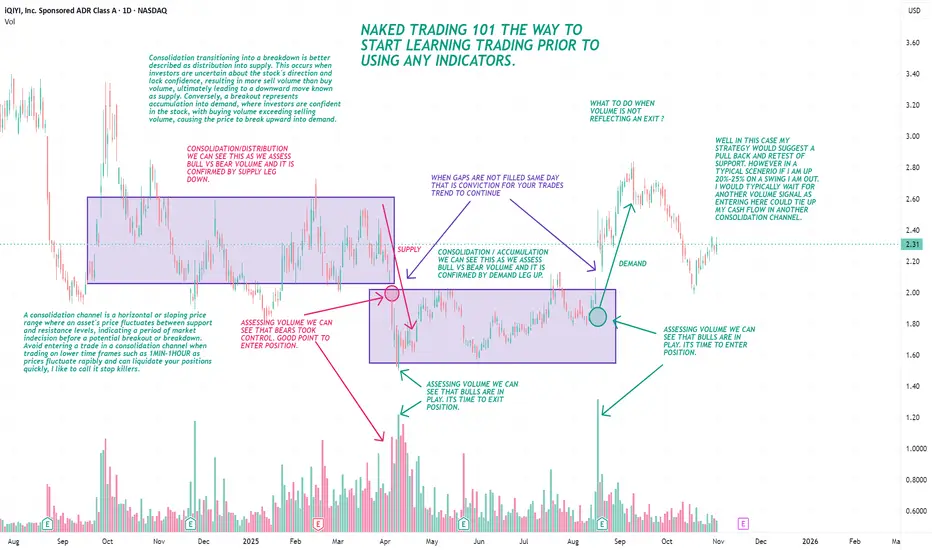
Assessing Volume: While primarily focused on price, analyzing volume can confirm price movements. For example, high volume during a price breakout can indicate strong buying or selling pressure.
Practicing with Historical Data: Test your understanding by reviewing historical charts and practicing identifying the above patterns and concepts before applying them in live trading.
By focusing on price action, traders can gain a clearer understanding of market dynamics and make more informed trading decisions without over-relying on technical indicators.
I hope you learned something today. If you are new here is where you need to start. If you are seasoned this is were you need to revisit.
Many of us have come across cautionary stories on Reddit trading groups. A common theme among these stories is that the traders involved never mastered the art of naked trading, or they overlooked its importance entirely.
Personally, I have two layouts saved on my TradingView account—one for my overall trading strategy and another specifically called "naked trading." I use both layouts simultaneously, appreciating and embracing the mental challenge that each approach provides.
Always remember your limits and never trade more than you are comfortable risking. Establish a stop-loss level that aligns with your strategy and risk tolerance; for me, it’s 7%, which I consider my lucky number. Knowing when to exit a trade is crucial. In day trading, my exit can range from 2% to 50%, depending on the stock's volatility. Swing trades typically have a maximum exit of around 25%, while position trades are more flexible, allowing me to exit when reversal patterns appear.
The core trading strategies are similar across all three types, but the key difference lies in your ability to process information quickly and how fast that category requires action.
For example:
Day Trading: Requires rapid analysis and decision-making, as market conditions change within minutes. If you lack quick critical thinking skills, day trading may not be suitable for you.
Swing Trading: Offers more leeway, with hours to days to analyze and act on market movements.
Position Trading: The most forgiving, providing days or even weeks to evaluate information and make decisions.
My investment portfolio incorporates a combination of strategies, with an allocation of 50% in position trading, 35% in swing trading, and 15% in day trading. I find value in each strategy and have benefited from mastering them collectively. It is crucial for anyone stepping into trading to grasp that the essence of trading lies in analyzing price action and assessing risks effectively. Success requires a deep understanding of both these elements.
Reflecting on my 15-year trading journey, I initially focused on discovering new strategies and shortcuts to enhance my trading performance, often overlooking the fundamental aspects of trading. Prior to utilizing any trading indicators, it is advisable for traders to thoroughly understand price action and its underlying mechanisms. A strong grasp of basic supply and demand principles is indispensable.
I have achieved considerable success in trading, often outperforming market conditions that challenge many. My success stems from refining and consistently adhering to my strategies, with a particular emphasis on interpreting price action from charts.
Price action is a fundamental concept in technical analysis that involves making trading decisions based on the historical price movements of an asset, without relying heavily on technical indicators. Here is an informative summary on how to use price action in technical analysis:
Understanding Price Patterns: Familiarize yourself with common price patterns, such as double tops and bottoms, head and shoulders, and flag patterns. These patterns can provide insights into potential trend reversals or continuations.
Identifying Support and Resistance Levels: Determine key support and resistance levels on a price chart. Support levels are where the price tends to stop falling, and resistance levels are where the price tends to stop rising. These levels can act as decision points for entering or exiting trades.
Analyzing Candlestick Patterns: Study candlestick charts to identify patterns like engulfing patterns, dojis, and hammers. Candlestick patterns can indicate market sentiment and potential price direction changes.
Evaluating Trend Lines: Draw trend lines by connecting the highs or lows on a price chart. Trend lines can help identify the direction of the market and potential breakout points.
Observing Market Structure: Pay attention to the overall market structure, including trend directions (uptrend, downtrend, sideways) and cycle phases (accumulation, markup, distribution, markdown).
Assessing Volume: While primarily focused on price, analyzing volume can confirm price movements. For example, high volume during a price breakout can indicate strong buying or selling pressure.
Practicing with Historical Data: Test your understanding by reviewing historical charts and practicing identifying the above patterns and concepts before applying them in live trading.
By focusing on price action, traders can gain a clearer understanding of market dynamics and make more informed trading decisions without over-relying on technical indicators.
I hope you learned something today. If you are new here is where you need to start. If you are seasoned this is were you need to revisit.
Disclaimer
The information and publications are not meant to be, and do not constitute, financial, investment, trading, or other types of advice or recommendations supplied or endorsed by TradingView. Read more in the Terms of Use.
Disclaimer
The information and publications are not meant to be, and do not constitute, financial, investment, trading, or other types of advice or recommendations supplied or endorsed by TradingView. Read more in the Terms of Use.