30-Minute Timeframe Analysis
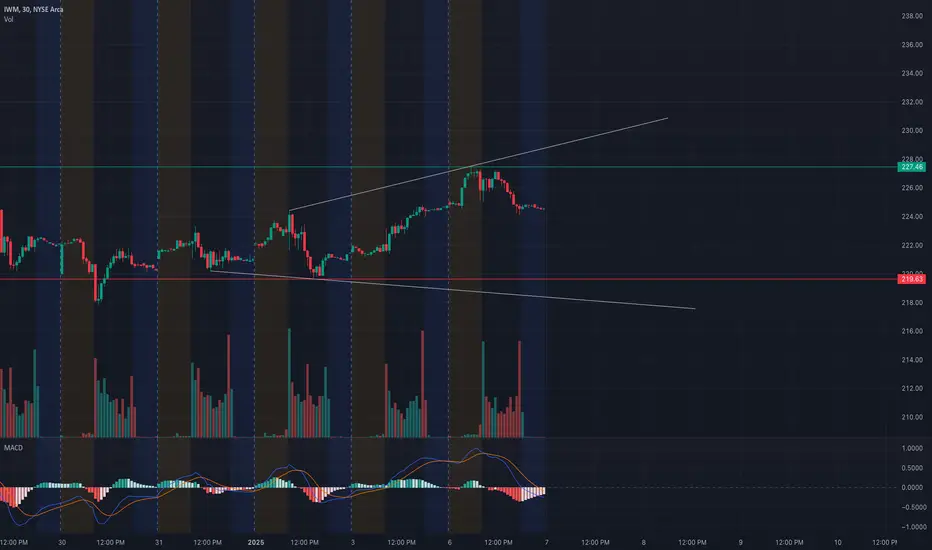
* Trend Overview: IWM has been trading within a rising wedge pattern, with recent resistance near $227.46 and support forming around $219.68. The price is showing signs of consolidation after a sharp move higher, indicating potential indecision. The market may gap up or down, which could disrupt this structure, so traders should reassess at the open and adapt accordingly.
* Key Levels:
* Support: $224.00 and $219.68 are important levels to hold if the price pulls back, especially during a gap down.
* Resistance: $227.46 and $228.00 are immediate levels to break for further bullish momentum, especially if the market gaps up.
* Indicators:
* MACD: Bearish crossover, suggesting a potential pullback or consolidation unless a gap up invalidates the signal.
* Volume: Decreasing volume near resistance signals caution; any breakout or breakdown needs to be supported by a surge in volume.
1-Hour GEX (Gamma Exposure) Insights
* Key Gamma Levels:
* Positive GEX: $225 and $227 are strong call resistance zones, with $225 being the highest positive gamma wall. A gap up could test these levels quickly.
* Negative GEX: $222 and $221 are key put support levels, providing protection in case of a gap down.
* Options Metrics:
* IVR: Low at 21.3, indicating a calm market environment, but potential for large moves remains if volatility spikes.
* Calls vs. Puts: Slightly bullish bias with calls at 1.1%, showing muted optimism.
* Actionable Gamma Zones:
* Bullish Scenario: Sustained price above $227.46 or a gap up could trigger a rally toward $228 and beyond.
* Bearish Scenario: A gap down below $224 may activate put support and drive the price toward $221.
Trade Scenarios
* Bullish Setup:
* Entry: Break and hold above $227.46, or after a gap up that sustains above $228.
* Target: $230.00 and $233.00.
* Stop-Loss: Below $225.00.
* Bearish Setup:
* Entry: Breakdown below $224.00, or after a gap down that fails to reclaim $225.
* Target: $221.00 and $219.68.
* Stop-Loss: Above $226.00.
Important Note for Traders
* Market gaps at the open can disrupt the current structure. Reassess price action during the pre-market session and adjust your plan to align with the updated conditions.
* If you need technical analysis for IWM or any other ticker, feel free to reach out for a personalized breakdown and actionable insights.
Disclaimer: This analysis is for educational purposes only and does not constitute financial advice. Please conduct your research and trade responsibly.
Disclaimer
The information and publications are not meant to be, and do not constitute, financial, investment, trading, or other types of advice or recommendations supplied or endorsed by TradingView. Read more in the Terms of Use.
Disclaimer
The information and publications are not meant to be, and do not constitute, financial, investment, trading, or other types of advice or recommendations supplied or endorsed by TradingView. Read more in the Terms of Use.