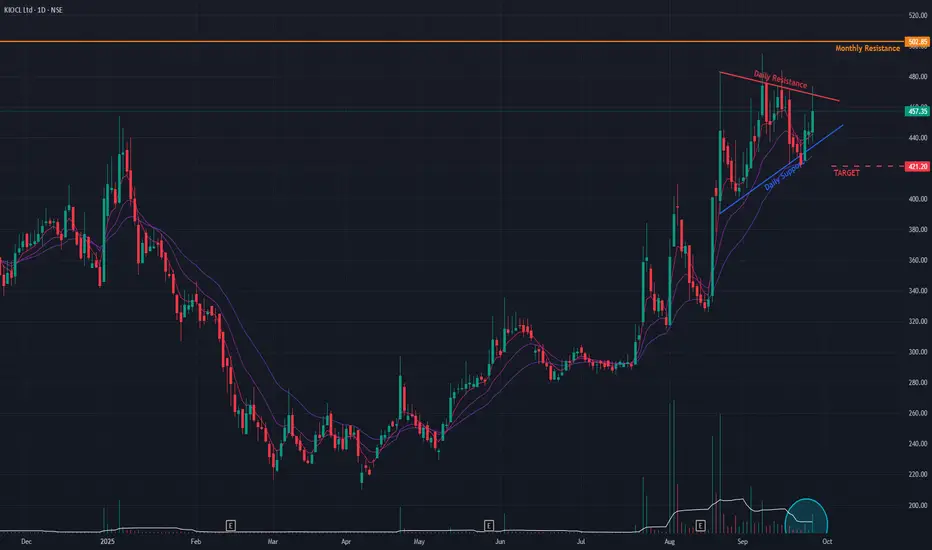
Following a powerful uptrend that has seen the stock gain over 125% since its bullish reversal in April 2025, KIOCL is now consolidating in a bullish Flag & Pole pattern. This chart formation is typically a continuation pattern, suggesting that the prior uptrend is likely to resume after this brief pause.
The stock is currently trading within the "flag" portion of the pattern. A breakout from this consolidation is the key trigger for the next potential move.
Broad-Based Bullish Indicators 👍
The underlying trend remains strong, supported by a host of positive technical signals:
- Multi-Timeframe Strength: Short-term Exponential Moving Averages (EMAs) are in a bullish state across the monthly, weekly, and daily charts.
- Confirmed Momentum: The Relative Strength Index (RSI) also confirms a bullish state on the monthly and weekly timeframes. While the daily RSI has not yet completed a bullish crossover, it is positioned to do so.
- Volume Buildup: A noticeable increase in trading volume during recent sessions suggests accumulation is taking place within the pattern.
Hurdles and Key Levels
For the uptrend to continue, the stock must first break out above the upper trendline of the flag pattern. Immediately following a potential breakout, it will face another significant hurdle in the form of a long-term horizontal resistance trendline.
- Bullish Case 📈: If the stock successfully breaks out of the flag pattern and sustains its momentum, the next potential price target is the resistance zone near ₹620.
- Bearish Case 📉: If the pattern fails and momentum is not sustained, the stock could pull back to find support near the ₹420 level. The price action in the coming days will be critical.
Disclaimer: This analysis is my personal view & for educational purposes only. They shall not be construed as trade or investment advice. Before making any financial decision, it is imperative that you consult with a qualified financial professional.
Disclaimer
The information and publications are not meant to be, and do not constitute, financial, investment, trading, or other types of advice or recommendations supplied or endorsed by TradingView. Read more in the Terms of Use.