Litecoin did what Litecoin always does: ripped on big headlines, went sideways, and then gave most of it back. Around the election/ETF chatter we saw that spike, then the whole move basically round-tripped.  LTC
LTC  LTCUSDT is a mean-reverting machine—great for quick trades, a pain in the ass to hold when the music stops.
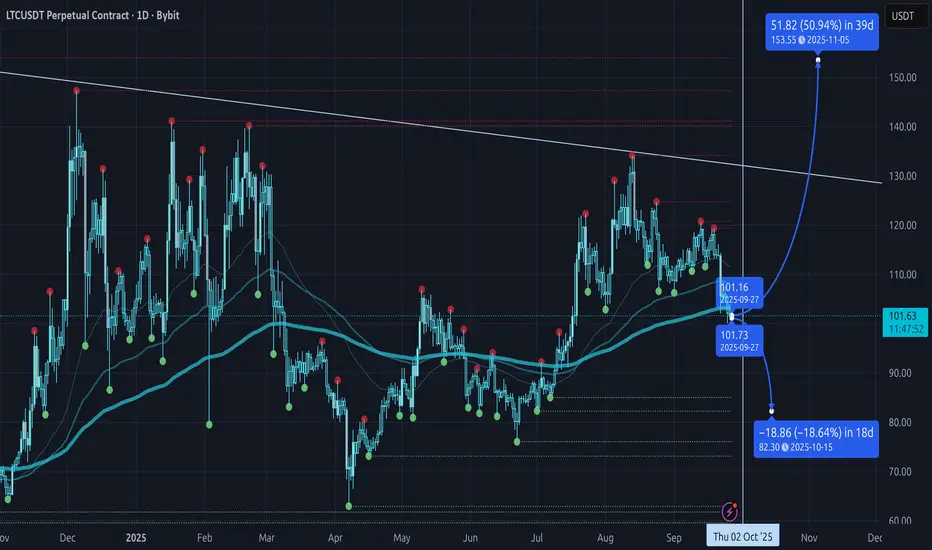
Zooming in to now: since the April lows we built up, corrected, built up again into the Aug 13th ~$130 high, and we’re back in correction mode. On the daily, price is sitting on the 200 EMA (right around the psychological $100 area). That’s my line in the sand. Lose the 200 EMA and the $100/$95 shelf, and I think we’re staring at the classic LTC full round-trip into $80 → $70–$65. That would basically unwind the whole April→August leg—again.
On the chart you can also see the macro descending trendline capping every pop (look how those red swing-high dots keep failing under it). Structure still hasn’t reclaimed the December 2024 highs, so bigger picture it’s still a downtrend until proven otherwise. For context, Litecoin has been compressing in a wide $65–$140 range for almost four years. Everyone wants the breakout to $200–$500…but the chart hasn’t confirmed a thing.
Now, we’ve got the Oct 2, 2025 ETF deadline hanging over this. Two ways this can play out:
Bear case (my concern right now): institutions bought April/June, sold the August euphoria to retailers, and are slowly unloading into every bounce while the narrative machine runs hot. That would explain why price can’t hold above the 200 EMA even with “bullish” headlines everywhere. If we lose $100/$95 with acceptance, I’m looking for that mean-reversion magnet at $70–$65 after a stop at $80.
Bull case (needs confirmation): we hold the 200 EMA, ETF news hits positive, and price squeezes back through $120 and on toward $140–$150. That would be the first clean step toward breaking the four-year range, but it still has to beat the trendline overhead. Until then, it’s just another rally into resistance.
Sentiment is noisy: Charlie Lee back on pods, the official accounts pushing hard, maxis loud on X—yet price isn’t following. When expectations are this high and the chart lags, it often means someone smarter is selling into it. Maybe I’m wrong and ETF demand lights the fuse—great, I’ll cheer it on—but next week feels like last resort. If LTC can’t bounce from the 200 EMA into the deadline, and instead rolls under $95, it likely does what it loves most: round-trip the pump.
Bottom line: 200 EMA = line in the sand. Hold it and maybe we squeeze toward $140–$150. Lose it, and the path of least resistance is $80 → $70–$65. The chart, not the headlines, will tell us which one it is.
Disclaimer
The information and publications are not meant to be, and do not constitute, financial, investment, trading, or other types of advice or recommendations supplied or endorsed by TradingView. Read more in the Terms of Use.
Disclaimer
The information and publications are not meant to be, and do not constitute, financial, investment, trading, or other types of advice or recommendations supplied or endorsed by TradingView. Read more in the Terms of Use.