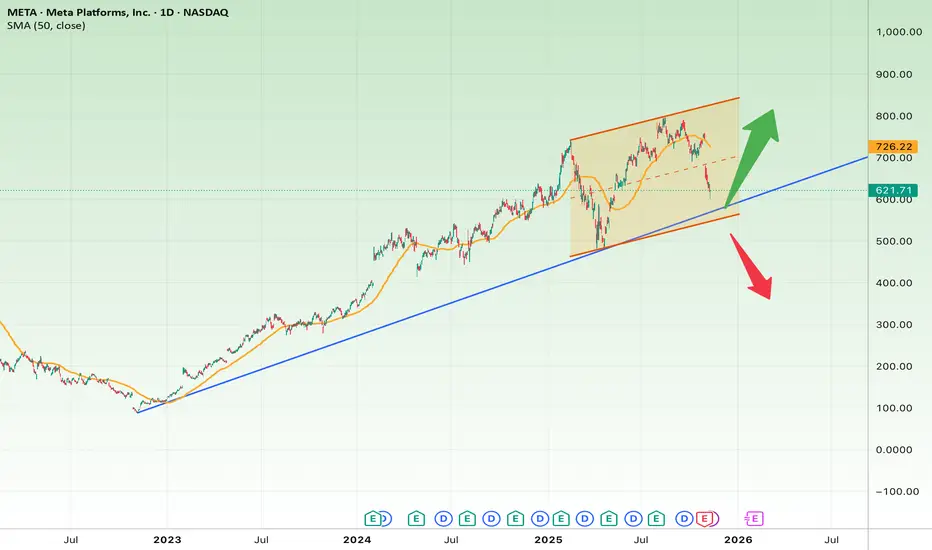
On the daily chart, META stock has been trading within a rising short-term channel after a strong uptrend from early 2023 to mid-2024. The price is now around $620, approaching the main long-term uptrend line (blue) drawn from the 2023 lows — a critical level that also aligns with the 50-day moving average (SMA50).
Bullish Scenario:
If META holds the $600–$630 support zone and forms a bullish reversal candle, a rebound toward $725 and potentially $800 could follow. This would confirm the continuation of the long-term uptrend.
Bearish Scenario:
If the trendline fails and the price closes below $580, a deeper correction toward $500 is likely. Such a breakdown would indicate the start of a medium-term consolidation phase.
Summary:
The $600 zone is the critical decision point — the line between trend continuation and correction.
As long as META trades above this level, the broader market structure remains bullish.
Disclaimer
The information and publications are not meant to be, and do not constitute, financial, investment, trading, or other types of advice or recommendations supplied or endorsed by TradingView. Read more in the Terms of Use.
Disclaimer
The information and publications are not meant to be, and do not constitute, financial, investment, trading, or other types of advice or recommendations supplied or endorsed by TradingView. Read more in the Terms of Use.