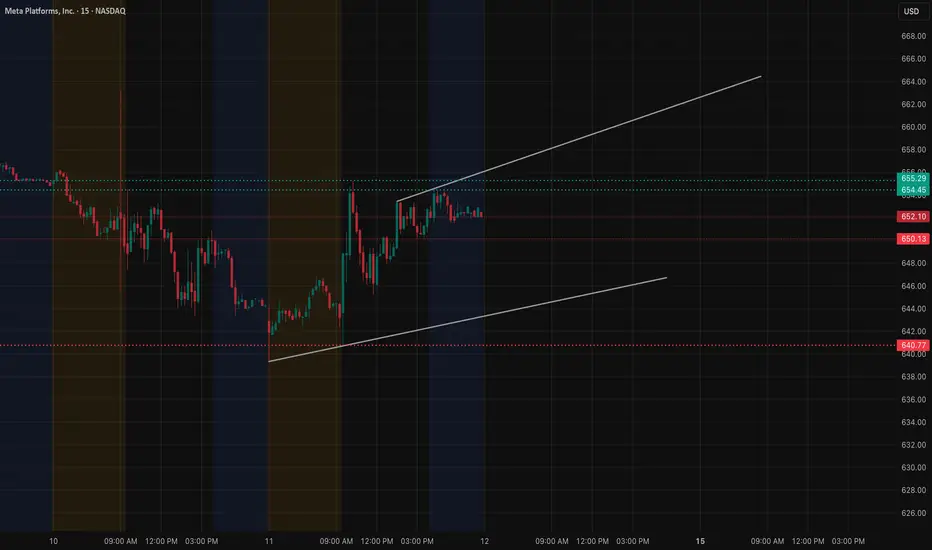
META continues to climb inside an ascending channel on the 15-minute timeframe, but price is now compressing into the upper boundary near 654–656. This zone has acted as intraday supply, and each test has produced smaller candles with decreasing momentum. When price moves like this—tight range, rising structure, slowing impulse—it often signals a larger move coming.
The lower boundary of the channel sits around 648–650, which held as the intraday demand zone multiple times today. Every pullback into this area was absorbed quickly, showing that buyers are still active as long as META stays above this pivot.
Now the question becomes: does this structure break upward or fail back toward the mid-channel? Let check GEX option data chart below.
This is where the options landscape becomes extremely useful.

The GEX levels show how options positioning is influencing price behavior, and today they lined up almost perfectly with META’s price structure. The 654–656 area, where price has been stalling, corresponds with a cluster of positive gamma levels. When price approaches these upper gamma zones, dealer hedging typically suppresses volatility, which explains the repeated slowdowns and rejections near that region.
Just above it, the next set of gamma resistance levels sits around 660–665. If price can break the 654–656 supply and hold above it, the hedging landscape shifts. Dealers would begin adjusting positions in a way that allows momentum to expand, opening room for META to test the 660 area first, then 665 if momentum continues.
On the downside, the 645–640 zone shows up as a negative gamma pocket. These levels align with the mid-channel and lower demand regions. If META loses the 650 pivot and slips under the rising channel, hedging flow begins to work in the opposite direction—volatility expands instead of compressing. That would naturally draw price toward 645–640, and a deeper break exposes the 635 zone where negative gamma becomes even more influential.
The correlation between price structure and options positioning makes the current setup straightforward:
• Holding the channel above 650 gives buyers room to challenge 654–656 again • Clearing 656 shifts both structure and GEX alignment toward 660–665 • Losing 650 flips the structure bearish and aligns with negative gamma flow toward 645–640
When both the chart structure and options landscape point to the same levels, it gives the setup much more conviction. META is approaching one of those moments where the next breakout or breakdown could set the tone for the entire day.
This analysis is for educational purposes only and not financial advice.
The lower boundary of the channel sits around 648–650, which held as the intraday demand zone multiple times today. Every pullback into this area was absorbed quickly, showing that buyers are still active as long as META stays above this pivot.
Now the question becomes: does this structure break upward or fail back toward the mid-channel? Let check GEX option data chart below.
This is where the options landscape becomes extremely useful.
The GEX levels show how options positioning is influencing price behavior, and today they lined up almost perfectly with META’s price structure. The 654–656 area, where price has been stalling, corresponds with a cluster of positive gamma levels. When price approaches these upper gamma zones, dealer hedging typically suppresses volatility, which explains the repeated slowdowns and rejections near that region.
Just above it, the next set of gamma resistance levels sits around 660–665. If price can break the 654–656 supply and hold above it, the hedging landscape shifts. Dealers would begin adjusting positions in a way that allows momentum to expand, opening room for META to test the 660 area first, then 665 if momentum continues.
On the downside, the 645–640 zone shows up as a negative gamma pocket. These levels align with the mid-channel and lower demand regions. If META loses the 650 pivot and slips under the rising channel, hedging flow begins to work in the opposite direction—volatility expands instead of compressing. That would naturally draw price toward 645–640, and a deeper break exposes the 635 zone where negative gamma becomes even more influential.
The correlation between price structure and options positioning makes the current setup straightforward:
• Holding the channel above 650 gives buyers room to challenge 654–656 again • Clearing 656 shifts both structure and GEX alignment toward 660–665 • Losing 650 flips the structure bearish and aligns with negative gamma flow toward 645–640
When both the chart structure and options landscape point to the same levels, it gives the setup much more conviction. META is approaching one of those moments where the next breakout or breakdown could set the tone for the entire day.
This analysis is for educational purposes only and not financial advice.
Disclaimer
The information and publications are not meant to be, and do not constitute, financial, investment, trading, or other types of advice or recommendations supplied or endorsed by TradingView. Read more in the Terms of Use.
Disclaimer
The information and publications are not meant to be, and do not constitute, financial, investment, trading, or other types of advice or recommendations supplied or endorsed by TradingView. Read more in the Terms of Use.