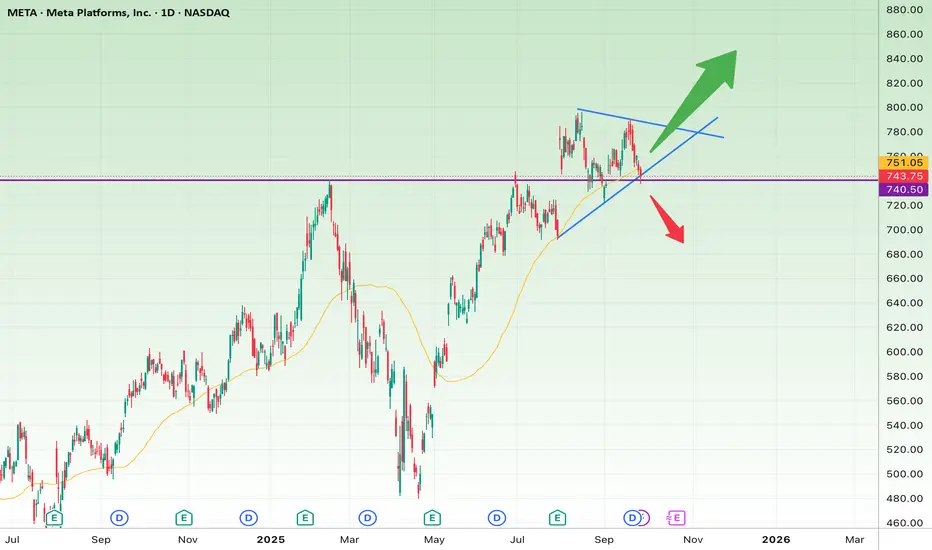
Based on the daily chart of Meta Platforms (META):
🔹 Short-Term Outlook (1–3 weeks)
The price is consolidating within a symmetrical triangle pattern, usually a sign of an upcoming breakout.
Key support: $740–$745 (aligned with the rising trendline and 50-day moving average).
Key resistance: $770–$780 (downtrend line of the triangle).
📈 Bullish scenario (short-term):
A breakout above $780 with strong volume could trigger a move toward $805 (first target) and $830 (second target).
Stop-loss: A sustained close below $740.
📉 Bearish scenario (short-term):
A breakdown below $740 opens the door for a quick drop toward $710, and possibly $680.
Stop-loss: Recovery and close back above $760.
🔹 Long-Term Outlook (3–6 months)
The broader trend remains bullish, and the recent pullback looks more like a consolidation within the larger uptrend.
If the price breaks and holds above $805, the medium-term targets are $860 and then $920.
On the downside, losing $680 could trigger a deeper correction toward $620.
✅ Summary:
Short-term: The triangle is nearing completion; whichever side breaks first will define the next move.
Long-term: As long as $680 holds, the bigger picture remains bullish.
Disclaimer
The information and publications are not meant to be, and do not constitute, financial, investment, trading, or other types of advice or recommendations supplied or endorsed by TradingView. Read more in the Terms of Use.
Disclaimer
The information and publications are not meant to be, and do not constitute, financial, investment, trading, or other types of advice or recommendations supplied or endorsed by TradingView. Read more in the Terms of Use.