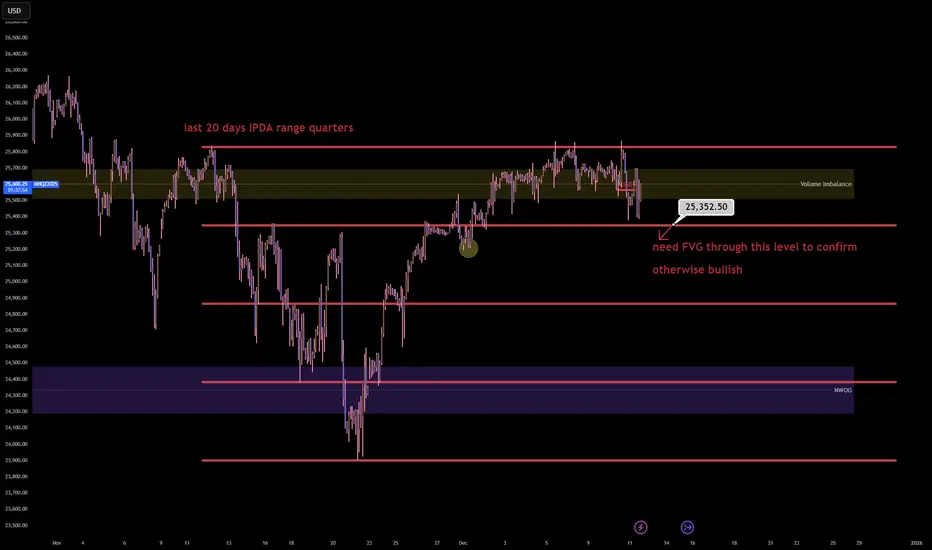
The Nasdaq 100 has entered the terminal phase of its 20 day institutional dealing range and is currently executing a distribution program within the premium quartile. The failure to sustain price acceptance above the 25,700.00 Volume Imbalance suggests the algorithm is preparing for a mean reversion event to rebalance the monthly ledger.
The present price action represents a classic 'Bull Trap' at the upper boundary of the range where retail momentum is being absorbed by institutional limit sell orders ahead of a repricing to equilibrium.
Entry: 25,550.00 (Sell Limit)
Stop loss: 25,880.00 (330.00 points)
Take profit: 24,850.00 (700.00 points)
Risk to reward ratio: 2.12R
 NQ1!
NQ1!  MNQ1! NASDAQ
The Opportunity
The 20 day IPDA lookback reveals that price is oscillating within a defined premium distribution block between 25,350.00 and 25,850.00. The market has expended significant energy to reach this valuation but has failed to close the daily candles above the key Volume Imbalance at 25,700.00.
This rejection signature implies that the 'Santa Rally' narrative has been utilized to engineer exit liquidity for smart money positions accumulated at the lows. The algorithm is an efficiency engine and it cannot justify a new macro expansion leg without first revisiting the internal range equilibrium to capitalize the move.
The Entry
Initiating a short position in the 25,550.00 to 25,600.00 zone aligns with the institutional logic of selling the upper 25% of the monthly range. This zone offers the highest statistical edge as it places the entry directly against the 'Ceiling' of the current volatility profile while targeting the 'Floor' of the recent expansion.
The Volume Imbalance acts as a natural defensive barrier for the stop loss as the algorithm will typically respect this array during a distribution phase.
The Invalidation
The bearish causal chain is ontologically corrupted if price achieves a daily close above the 25,880.00 range high. Such an event would signify a 'Blue Sky' breakout and a shift in regime from range bound to trending.
If the market accepts price above this threshold it implies that the premium valuation has become the new floor and the algorithm is targeting the 26,000.00 psychological level.
Key Trajectory Waypoints
Target 1: 25,350.00 | Type: 75% Range Quartile | Probability: 70% | ETA: 24 Hours
Target 2: 24,850.00 | Type: Range Equilibrium (50%) | Probability: 60% | ETA: 2-3 Days
Target 3: 24,400.00 | Type: NWOG / Discount Target | Probability: 40% | ETA: Next Week
The Shadow Reality
A 35% probability exists for the antithetical reality: The Range Expansion.
In this scenario the current consolidation is a 'High Tight Flag' and the algorithm ignores the equilibrium requirement to force a squeeze into the 26,000.00 level immediately.
This reality is confirmed if price holds above 25,650.00 for two consecutive 4 hour closes.
The present price action represents a classic 'Bull Trap' at the upper boundary of the range where retail momentum is being absorbed by institutional limit sell orders ahead of a repricing to equilibrium.
Entry: 25,550.00 (Sell Limit)
Stop loss: 25,880.00 (330.00 points)
Take profit: 24,850.00 (700.00 points)
Risk to reward ratio: 2.12R
The Opportunity
The 20 day IPDA lookback reveals that price is oscillating within a defined premium distribution block between 25,350.00 and 25,850.00. The market has expended significant energy to reach this valuation but has failed to close the daily candles above the key Volume Imbalance at 25,700.00.
This rejection signature implies that the 'Santa Rally' narrative has been utilized to engineer exit liquidity for smart money positions accumulated at the lows. The algorithm is an efficiency engine and it cannot justify a new macro expansion leg without first revisiting the internal range equilibrium to capitalize the move.
The Entry
Initiating a short position in the 25,550.00 to 25,600.00 zone aligns with the institutional logic of selling the upper 25% of the monthly range. This zone offers the highest statistical edge as it places the entry directly against the 'Ceiling' of the current volatility profile while targeting the 'Floor' of the recent expansion.
The Volume Imbalance acts as a natural defensive barrier for the stop loss as the algorithm will typically respect this array during a distribution phase.
The Invalidation
The bearish causal chain is ontologically corrupted if price achieves a daily close above the 25,880.00 range high. Such an event would signify a 'Blue Sky' breakout and a shift in regime from range bound to trending.
If the market accepts price above this threshold it implies that the premium valuation has become the new floor and the algorithm is targeting the 26,000.00 psychological level.
Key Trajectory Waypoints
Target 1: 25,350.00 | Type: 75% Range Quartile | Probability: 70% | ETA: 24 Hours
Target 2: 24,850.00 | Type: Range Equilibrium (50%) | Probability: 60% | ETA: 2-3 Days
Target 3: 24,400.00 | Type: NWOG / Discount Target | Probability: 40% | ETA: Next Week
The Shadow Reality
A 35% probability exists for the antithetical reality: The Range Expansion.
In this scenario the current consolidation is a 'High Tight Flag' and the algorithm ignores the equilibrium requirement to force a squeeze into the 26,000.00 level immediately.
This reality is confirmed if price holds above 25,650.00 for two consecutive 4 hour closes.
Telegram: t.me/tradeconfirmed
Disclaimer
The information and publications are not meant to be, and do not constitute, financial, investment, trading, or other types of advice or recommendations supplied or endorsed by TradingView. Read more in the Terms of Use.
Telegram: t.me/tradeconfirmed
Disclaimer
The information and publications are not meant to be, and do not constitute, financial, investment, trading, or other types of advice or recommendations supplied or endorsed by TradingView. Read more in the Terms of Use.