MSFT has been trading in a strangely controlled rhythm these last few sessions. It keeps pressing into the same resistance band around 510–513, fails, dips into demand around 498–500, and snaps back with force. When I line up the 1H structure, the 15M flow, and the GEX positioning, it paints a very clear picture: MSFT is preparing for a real move, it just hasn’t chosen a side yet.
I’ll walk through how I’m looking at it.
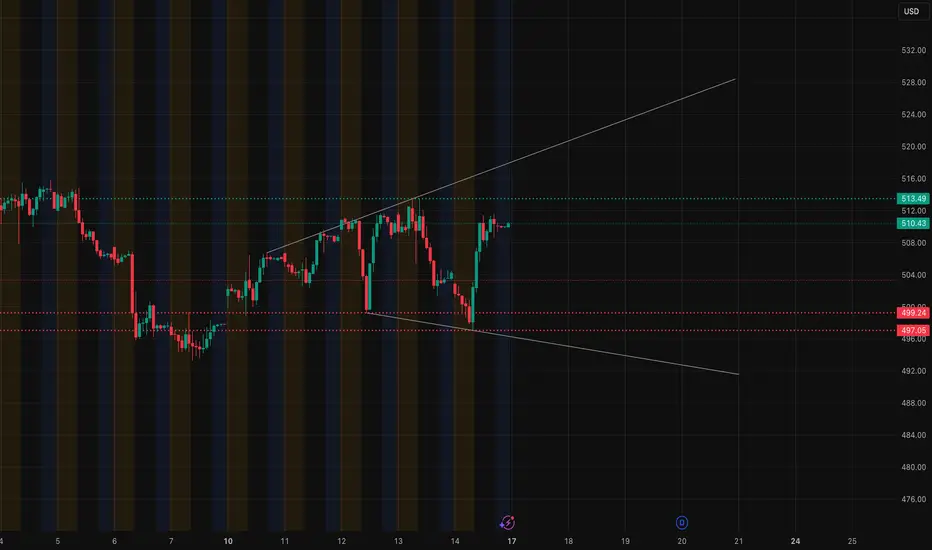
1️⃣ 1-Hour Chart — A Tight Compression Between Two Walls
On the 1H, MSFT has been respecting a rising trendline while continuously getting capped under the 510–513 band. Price keeps pushing into that ceiling but never fully breaks through. That alone tells me sellers are defending this zone aggressively.
But on the flip side, buyers haven’t stepped away either. Every time MSFT flushes into the 498–500 area, it gets bought almost instantly. It’s almost mechanical.
So the 1H picture is simple:
* Pressure building under 510–513
* Strong buy response at 498–500
* Trendline rising underneath
When you see that combination, it usually means the breakout will be clean once it finally triggers.
2️⃣ 15-Minute Chart — Intraday Rotation Shows Intent

The 15M chart adds more detail. Right now, MSFT is trading inside yesterday’s freshly formed supply zone near 512–513, where multiple bearish FVGs stacked together. Price tapped that area and pulled back, but the pullback was shallow and controlled.
That’s usually a sign buyers didn’t leave—just waiting.
There are also several bullish FVGs layered below:
* 506.8
* 504.5
* 501–502
These zones often act like stepping stones if price chooses an upward move. What I like here is that MSFT didn’t give back its entire run. It retraced only to the nearest FVG and held—strong behavior during a potential breakout setup.
This 15M structure leans slightly bullish, but it needs confirmation.
3️⃣ GEX Chart — Where MSFT Is Actually Being Pulled

This part is where most traders miss the real story.
The GEX map shows extremely clear levels that explain why MSFT keeps stalling at the same places:
Upside Gamma Levels
* 513.49 → strong resistance zone
* 520 → 2nd call wall
* 525+ → deep positive GEX cluster
If MSFT breaks above 513, it has clean air toward 520, and if momentum is strong, 525 becomes possible. These gamma walls often act like magnets once price clears the top.
Downside Hedging Zones
* 500.00 → primary PUT support
* 497.05 → second PUT level
* 493.25 → deeper hedge zone
This explains why 500 keeps getting defended every time—it’s a real options wall where market makers hedge hard.
What I like about this GEX setup is how cleanly it aligns with the levels on your 1H and 15M charts. When price action and dealer positioning line up, the move becomes easier to trust.
And yes—if someone hasn’t used GEX before, this is one of those charts that makes them ask, “Why does MSFT bounce exactly there every time?” That’s where GEX comes in.
🎯 How I’m Planning MSFT for 11/17
🔼 Bullish Plan (Only Above 513)
If MSFT manages to break 513 and consolidate above it, the upside can be impressive.
Stock Trade Idea:
* Entry: 513.20–513.50
* Targets:
* 515
* 517
* 520 (GEX wall)
* 525 (if SPY and QQQ trend strong)
Options Idea:
* 515C or 520C
* Best entries come after 513 holds
* Trim at each major GEX magnet
🔽 Bearish Plan (If 500 Fails)
A clean break below 500 flips the structure immediately.
Stock Trade Idea:
* Entry: 499.20–499.00
* Targets:
* 497
* 493
* 490 (extended move)
Options Idea:
* 500P or 495P
* Downside accelerates quickly below 500 because hedging flips direction
* Fast scalps toward the PUT wall zones
⚠️ Chop Zone: 506–510
This is where MSFT keeps moving sideways with no conviction. I’d avoid trading here unless volatility expands.
Final Thoughts
MSFT is one of those charts that looks boring at first glance but becomes incredibly clean once you stack multiple timeframes with the GEX levels. Both sides have clear control zones, and both sides have a reason to defend.
The real trade begins at 513 or 500. Everything in between is noise.
Disclaimer
This analysis is for educational purposes only and does not constitute financial advice. Always perform your own research and manage your risk.
I’ll walk through how I’m looking at it.
1️⃣ 1-Hour Chart — A Tight Compression Between Two Walls
On the 1H, MSFT has been respecting a rising trendline while continuously getting capped under the 510–513 band. Price keeps pushing into that ceiling but never fully breaks through. That alone tells me sellers are defending this zone aggressively.
But on the flip side, buyers haven’t stepped away either. Every time MSFT flushes into the 498–500 area, it gets bought almost instantly. It’s almost mechanical.
So the 1H picture is simple:
* Pressure building under 510–513
* Strong buy response at 498–500
* Trendline rising underneath
When you see that combination, it usually means the breakout will be clean once it finally triggers.
2️⃣ 15-Minute Chart — Intraday Rotation Shows Intent
The 15M chart adds more detail. Right now, MSFT is trading inside yesterday’s freshly formed supply zone near 512–513, where multiple bearish FVGs stacked together. Price tapped that area and pulled back, but the pullback was shallow and controlled.
That’s usually a sign buyers didn’t leave—just waiting.
There are also several bullish FVGs layered below:
* 506.8
* 504.5
* 501–502
These zones often act like stepping stones if price chooses an upward move. What I like here is that MSFT didn’t give back its entire run. It retraced only to the nearest FVG and held—strong behavior during a potential breakout setup.
This 15M structure leans slightly bullish, but it needs confirmation.
3️⃣ GEX Chart — Where MSFT Is Actually Being Pulled
This part is where most traders miss the real story.
The GEX map shows extremely clear levels that explain why MSFT keeps stalling at the same places:
Upside Gamma Levels
* 513.49 → strong resistance zone
* 520 → 2nd call wall
* 525+ → deep positive GEX cluster
If MSFT breaks above 513, it has clean air toward 520, and if momentum is strong, 525 becomes possible. These gamma walls often act like magnets once price clears the top.
Downside Hedging Zones
* 500.00 → primary PUT support
* 497.05 → second PUT level
* 493.25 → deeper hedge zone
This explains why 500 keeps getting defended every time—it’s a real options wall where market makers hedge hard.
What I like about this GEX setup is how cleanly it aligns with the levels on your 1H and 15M charts. When price action and dealer positioning line up, the move becomes easier to trust.
And yes—if someone hasn’t used GEX before, this is one of those charts that makes them ask, “Why does MSFT bounce exactly there every time?” That’s where GEX comes in.
🎯 How I’m Planning MSFT for 11/17
🔼 Bullish Plan (Only Above 513)
If MSFT manages to break 513 and consolidate above it, the upside can be impressive.
Stock Trade Idea:
* Entry: 513.20–513.50
* Targets:
* 515
* 517
* 520 (GEX wall)
* 525 (if SPY and QQQ trend strong)
Options Idea:
* 515C or 520C
* Best entries come after 513 holds
* Trim at each major GEX magnet
🔽 Bearish Plan (If 500 Fails)
A clean break below 500 flips the structure immediately.
Stock Trade Idea:
* Entry: 499.20–499.00
* Targets:
* 497
* 493
* 490 (extended move)
Options Idea:
* 500P or 495P
* Downside accelerates quickly below 500 because hedging flips direction
* Fast scalps toward the PUT wall zones
⚠️ Chop Zone: 506–510
This is where MSFT keeps moving sideways with no conviction. I’d avoid trading here unless volatility expands.
Final Thoughts
MSFT is one of those charts that looks boring at first glance but becomes incredibly clean once you stack multiple timeframes with the GEX levels. Both sides have clear control zones, and both sides have a reason to defend.
The real trade begins at 513 or 500. Everything in between is noise.
Disclaimer
This analysis is for educational purposes only and does not constitute financial advice. Always perform your own research and manage your risk.
Disclaimer
The information and publications are not meant to be, and do not constitute, financial, investment, trading, or other types of advice or recommendations supplied or endorsed by TradingView. Read more in the Terms of Use.
Disclaimer
The information and publications are not meant to be, and do not constitute, financial, investment, trading, or other types of advice or recommendations supplied or endorsed by TradingView. Read more in the Terms of Use.