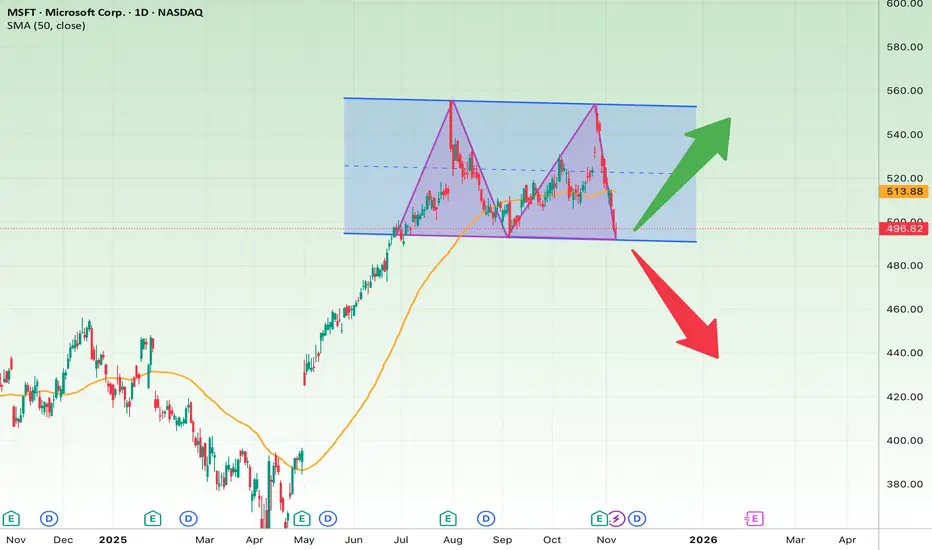
The daily chart of Microsoft (MSFT) shows that the stock is moving within a horizontal range between approximately 495 and 540 dollars, with a potential bearish Double Top pattern forming. The price is currently testing a critical support area that could determine the next major move.
Structure and Trend Analysis
After a strong rally from early 2025, Microsoft entered a consolidation phase with sideways movement. Two clear peaks near 540 dollars indicate a possible Double Top pattern, which is often a signal of a trend reversal. The 50-day moving average, located around 488 dollars, has started to flatten, confirming the loss of short-term momentum. At the moment, the price is trading slightly above the key horizontal support at 495 dollars, which aligns with previous reaction lows.
Bullish Scenario
If Microsoft can hold above 495 dollars and bounce from this level, it will likely retest the upper boundary of the range near 540 dollars. Final confirmation comes if the price breaks above 540 with strong momentum. In this case, the short-term target would be between 525 and 540 dollars, and the mid-term target between 565 and 580 dollars. A reasonable stop loss for this setup would be a close below 490 dollars. A rebound from this area would indicate accumulation and the potential continuation of the long-term uptrend.
Bearish Scenario
If the price breaks below 495 dollars with increased selling volume, the Double Top pattern would be confirmed. In that case, the price could fall toward the 430 to 440 dollar range. The short-term target would be around 465 dollars, and the long-term target near 430 dollars, while the stop loss would be set above 510 dollars. A decisive close below the support zone would confirm a change in direction and could trigger a deeper correction.
Timeframe Outlook
In the short term, over the next one to three weeks, the stock may continue moving sideways between 495 and 520 dollars as traders wait for a breakout or breakdown signal. In the medium to long term, over the next two to four months, a breakout above 540 dollars could lead to a rally toward 580 dollars, while a breakdown below 495 dollars could open the path to 430 dollars, aligning with the Double Top pattern’s projected target.
Disclaimer
The information and publications are not meant to be, and do not constitute, financial, investment, trading, or other types of advice or recommendations supplied or endorsed by TradingView. Read more in the Terms of Use.
Disclaimer
The information and publications are not meant to be, and do not constitute, financial, investment, trading, or other types of advice or recommendations supplied or endorsed by TradingView. Read more in the Terms of Use.