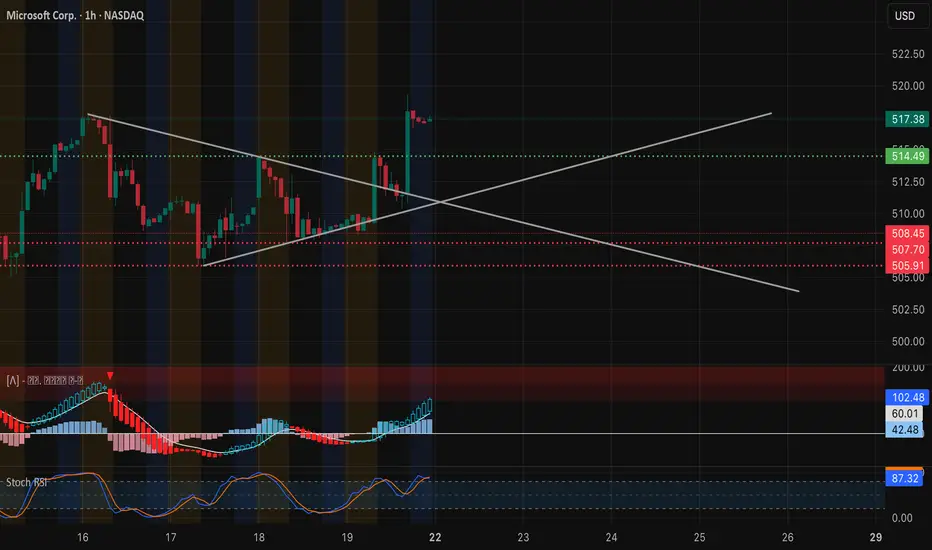
1️⃣ Big Picture on the 1-Hour Chart
* Price action: Microsoft closed around 517.38, breaking out of a multi-day consolidation. Price ripped above 514.5 and is holding gains just under the next resistance zone.
* Key levels:
* Resistance: 519.3 → 525 (recent high and call wall)
* Support: 514.5 → 510 (former resistance and trendline retest area)
* Indicators:
* MACD is strong and rising, showing solid bullish momentum.
* Stoch RSI is elevated near 87, signaling overbought conditions that could lead to a short pause or pullback.
The short-term structure is bullish, but after a sharp pop, MSFT might need to consolidate to build fresh energy.
2️⃣ GEX / Options Flow
* Largest call clusters appear around 525 and 540, with notable resistance at 520 already being tested.
* Key put support stands at 502.5, with heavier walls near 497.5 and 495.
* IVR sits at 7.8—low compared to historical norms—indicating that option premiums remain relatively cheap for quick trades.
The options board suggests market makers may try to pin MSFT in the 514–520 area if momentum cools. A decisive close above 520 would shift gamma flows toward 525–530 quickly.
3️⃣ Trading Thoughts & Suggestions
* Scalp / day trade: Watch for a sustained push over 519–520 with strong volume. Target 523–525, with a tight stop below 516.
* Support bounce: A controlled dip back to 514–515 that holds could provide a fresh long entry.
* Fade setup: A quick rejection at 520–523 with heavy selling pressure could send price back to 510–505.
4️⃣ Bottom Line
MSFT just broke out of its consolidation box and is testing key resistance. Bulls need a clean break above 520 for another leg higher. Bears want to see a rejection at 520 with a fade back toward 510.
Disclaimer: This is just market opinion for educational discussion. It’s not financial advice. Always manage your own risk before trading.
Disclaimer
The information and publications are not meant to be, and do not constitute, financial, investment, trading, or other types of advice or recommendations supplied or endorsed by TradingView. Read more in the Terms of Use.
Disclaimer
The information and publications are not meant to be, and do not constitute, financial, investment, trading, or other types of advice or recommendations supplied or endorsed by TradingView. Read more in the Terms of Use.