1-Hour Outlook
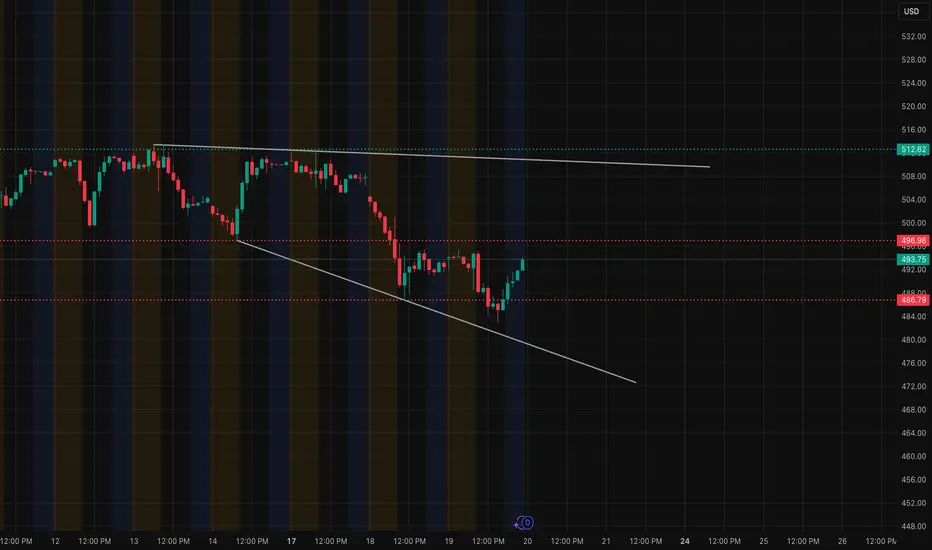
MSFT has been in a clean down-channel, but today's late-session recovery finally broke above the short-term lower trendline. Price is now pushing into a critical resistance zone around $502–$505, which has rejected multiple times this week.
Key levels from the 1-hour structure:
* First resistance: $498.50
* Main rejection zone: $502–$505
* Bull breakout confirmation: $510 → opens $513–$515
* Downside support: $490, then $485
Momentum is improving — MACD is curling up and the candle structure is shifting away from heavy sell pressure. But MSFT still needs to reclaim $502.50 with conviction before bulls gain control for tomorrow.
1-Hour Bias: Cautiously bullish if above $498.50, but still inside a larger downtrend unless $502–$505 breaks.
15-Minute Outlook (For Traders)

Short-term price action shows MSFT breaking out of a wedge and retesting the breakout cleanly around $493–$494. Strong impulsive candles came in after the retest.
What matters for tomorrow:
* As long as MSFT holds above $493–$494, buyers can push into $498–$500.
* A clean move through $500 → $502.50 would trigger momentum traders.
* If MSFT rejects early at $498–$500, expect a pullback to $490–$492.
15-Min Trading Thoughts:
* Bull setup: Pullback to $494–$496 with bounce confirmation → targets $500 / $502.
* Bear setup: Rejection at $502–$505 → targets $492 then $488.
Momentum is stronger on the 15-min chart than the 1-hour, which means MSFT has room to squeeze early but may struggle at $502–$505 unless volume shows up.
How GEX Supports the Levels

From the GEX (Gamma Exposure) chart:
Bullish elements:
* Highest positive call interest sits above $510–$515, meaning if MSFT breaks $505, market makers hedge by buying → upward acceleration.
* Light resistance around $500–$502, so price can push into that zone easily.
Bearish elements:
* Strong negative GEX / put support at $485, acting as the floor for the week.
* Heavy put walls between $480–$485, making breakdowns less likely unless market-wide selling hits.
GEX Summary:
* Break $505 → path to $510–$513 opens quickly.
* Lose $490 → hedging pressure drives it toward $485.
Option Trading Suggestions Based on GEX
For tomorrow's session:
Bullish Idea
If MSFT breaks and holds over $502.50:
* Consider 505C or 510C, same-week expiration.
* Safer choice: Next-week 510C (less decay).
Reason: GEX shows low resistance between $505 → $510.
Bearish Idea
If MSFT rejects $502–$505 early:
* Consider 495P or 490P.
* Conservative approach: next-week 490P.
Reason: Price tends to fade back into the $492–$488 pocket when the breakout fails.
Final Thoughts
MSFT is at a key pivot zone. Both 1-hour and 15-minute charts show recovery momentum, but the chart won’t turn fully bullish unless $502.50–$505 breaks. Expect volatility around that zone tomorrow.
Disclaimer
This analysis is for educational purposes only and is not financial advice. Always manage risk and trade with a plan.
MSFT has been in a clean down-channel, but today's late-session recovery finally broke above the short-term lower trendline. Price is now pushing into a critical resistance zone around $502–$505, which has rejected multiple times this week.
Key levels from the 1-hour structure:
* First resistance: $498.50
* Main rejection zone: $502–$505
* Bull breakout confirmation: $510 → opens $513–$515
* Downside support: $490, then $485
Momentum is improving — MACD is curling up and the candle structure is shifting away from heavy sell pressure. But MSFT still needs to reclaim $502.50 with conviction before bulls gain control for tomorrow.
1-Hour Bias: Cautiously bullish if above $498.50, but still inside a larger downtrend unless $502–$505 breaks.
15-Minute Outlook (For Traders)
Short-term price action shows MSFT breaking out of a wedge and retesting the breakout cleanly around $493–$494. Strong impulsive candles came in after the retest.
What matters for tomorrow:
* As long as MSFT holds above $493–$494, buyers can push into $498–$500.
* A clean move through $500 → $502.50 would trigger momentum traders.
* If MSFT rejects early at $498–$500, expect a pullback to $490–$492.
15-Min Trading Thoughts:
* Bull setup: Pullback to $494–$496 with bounce confirmation → targets $500 / $502.
* Bear setup: Rejection at $502–$505 → targets $492 then $488.
Momentum is stronger on the 15-min chart than the 1-hour, which means MSFT has room to squeeze early but may struggle at $502–$505 unless volume shows up.
How GEX Supports the Levels
From the GEX (Gamma Exposure) chart:
Bullish elements:
* Highest positive call interest sits above $510–$515, meaning if MSFT breaks $505, market makers hedge by buying → upward acceleration.
* Light resistance around $500–$502, so price can push into that zone easily.
Bearish elements:
* Strong negative GEX / put support at $485, acting as the floor for the week.
* Heavy put walls between $480–$485, making breakdowns less likely unless market-wide selling hits.
GEX Summary:
* Break $505 → path to $510–$513 opens quickly.
* Lose $490 → hedging pressure drives it toward $485.
Option Trading Suggestions Based on GEX
For tomorrow's session:
Bullish Idea
If MSFT breaks and holds over $502.50:
* Consider 505C or 510C, same-week expiration.
* Safer choice: Next-week 510C (less decay).
Reason: GEX shows low resistance between $505 → $510.
Bearish Idea
If MSFT rejects $502–$505 early:
* Consider 495P or 490P.
* Conservative approach: next-week 490P.
Reason: Price tends to fade back into the $492–$488 pocket when the breakout fails.
Final Thoughts
MSFT is at a key pivot zone. Both 1-hour and 15-minute charts show recovery momentum, but the chart won’t turn fully bullish unless $502.50–$505 breaks. Expect volatility around that zone tomorrow.
Disclaimer
This analysis is for educational purposes only and is not financial advice. Always manage risk and trade with a plan.
Disclaimer
The information and publications are not meant to be, and do not constitute, financial, investment, trading, or other types of advice or recommendations supplied or endorsed by TradingView. Read more in the Terms of Use.
Disclaimer
The information and publications are not meant to be, and do not constitute, financial, investment, trading, or other types of advice or recommendations supplied or endorsed by TradingView. Read more in the Terms of Use.