📊 Nasdaq – Technical Setup & Market Catalysts
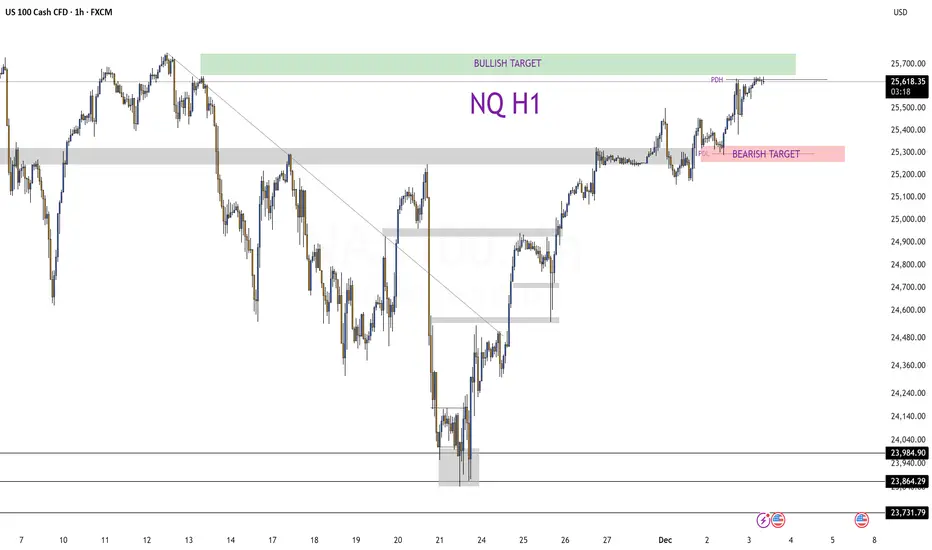
The index recently tested a previously unfilled Fair Value Gap (H1 timeframe) and swept liquidity from last week’s accumulation — a process that often precedes new directional moves. The move cleared many trapped positions and reset the orderbook.
Currently, Nasdaq is sitting below a strong resistance zone; price appears to be weakening, which increases the probability of a short-term pullback toward the Previous Day Low (PDL) to collect more liquidity before any further upside attempt.
Momentum indicators and price structure suggest caution: while the general uptrend remains, a lack of upward acceleration and signs of hesitation point toward a possible consolidation or retracement.
🌍 Fundamental & Macro Context
Optimism remains in markets thanks to rising investor expectations of a rate cut by the Federal Reserve (Fed) this December. This sentiment supports risk assets, and tech stocks in particular — historically sensitive to interest rates and discounting future earnings.
However, some analysts warn that valuations in the tech sector — which heavily influence Nasdaq — are rich relative to earnings. The forward P/E ratio sits well above long-term averages, increasing vulnerability if economic data disappoints or if rate cuts are delayed.
Broader macro conditions remain fragile: global yield curves and bond markets show signs of stress, which could add volatility. Also, inflation trends and upcoming U.S. data releases could shift sentiment quickly.
🎯 What to Watch Next
Pullback zone: Look for support near the PDL or recent liquidity area — potential buying zone if price stabilizes.
Breakout zone: If Nasdaq breaks above resistance with strength and volume, upside is open toward higher targets set pre-rally.
Catalysts: Fed rate-cut expectations, upcoming economic data (inflation, employment, PMI), and tech sector earnings will influence direction strongly.
Disclaimer
The information and publications are not meant to be, and do not constitute, financial, investment, trading, or other types of advice or recommendations supplied or endorsed by TradingView. Read more in the Terms of Use.
Disclaimer
The information and publications are not meant to be, and do not constitute, financial, investment, trading, or other types of advice or recommendations supplied or endorsed by TradingView. Read more in the Terms of Use.