As a trader it can be helpful to spend some time on a Sunday afternoon sitting at your trading desk gathering your thoughts and preparing for the week ahead. Checking the Pepperstone economic calendar to assess the scheduled risk events in terms of timing and importance can be a useful part of this process. This upcoming week is quite impressive, packed with central bank meetings and economic data that could impact many, if not all, of the major markets available to trade on the Pepperstone platform.
The standout event could be the Federal Reserve (Fed) interest rate announcement on Wednesday at 1900 BST, which is followed closely by the press conference led by Chairman Powell, which starts at 1930 BST. However, Thursday’s Bank of England interest rate decision at 1200 BST, or Friday’s Bank of Japan interest rate decision due at 0400 BST, and then the press conference led by Governor Ueda may also keep traders on volatility alert.

The US 100 index is the focus of today’s commentary as it can be more sensitive than other indices to interest rate moves made by the Fed.
As can be seen on the daily Pepperstone chart above, the US 100 index has experienced a period of higher highs and higher lows since the 2025 low was hit way back at 16290 on April 7th, helped in no small part by a re-engagement of traders with the potential of artificial intelligence and what it could mean for the future earnings of the leading companies in this space. This AI driver is still in very much in play but may take a backseat this week due to the Federal Reserve rate decision.
Since the surprise weaker than expected US employment report on August 1st (Non-farm payrolls) market expectations for Fed rate cuts have increased, helping to support the latest US 100 uptrend from its August 1st lows at 22678 to print numerous record closing highs, the latest being Friday at 24096.
For the Fed interest rate decision on Wednesday, a 25bps (0.25%) cut is fully priced by traders, but there is a small outside chance of a 50bps (0.5%) cut, a decision which, if it happened, could generate equal amounts of uncertainty that policy makers feel they could be behind the curve in supporting the economy and that the labour market is weakening faster than anticipated, but also surprise that the Fed may be willing to cut rates faster, which as a general rule can be supportive of US100 index gains.
The press conference may also be a relevant consideration for US 100 price volatility. Traders will be keen to hear Chairman Powell’s stance on the possibility for further rate cuts, with economists predicting just one more 25bps cut into the end of 2025, while the market is pricing another 2 25bps reductions. Any comments he makes on the independence of the US central bank, with an appeal court ruling expected imminently on whether President Trump has the authority to sack Fed Governor Cook, as well as his thoughts on the deterioration of the US labour markets and direction of inflation could also be important.
Technical Update: New All-Time Highs Posted
After reaching a new all-time high of 24142 on Friday, the market continues to show signs of a positive trend, which has been evident since the low of 16290 recorded on April 7th.
As the chart above shows, the market has formed a pattern of higher highs and higher lows. While this doesn’t guarantee that prices will continue to rise, the recent new peak suggests there might be further upward momentum ahead.
Although positive sentiment appears to remain in place, this week’s upcoming data releases and interest rate decision could significantly impact price movements.
As a result, it may be important to identify and then monitor key support and resistance levels in case an increased spell of volatility emerges.
Potential Resistance Levels:
Following the recording of the latest all-time high at 24142 on Friday, traders may be anticipating continued attempts at upward momentum to extend the current uptrend.
The outlook suggests that further attempts to push toward the next resistance levels could emerge in the coming week.
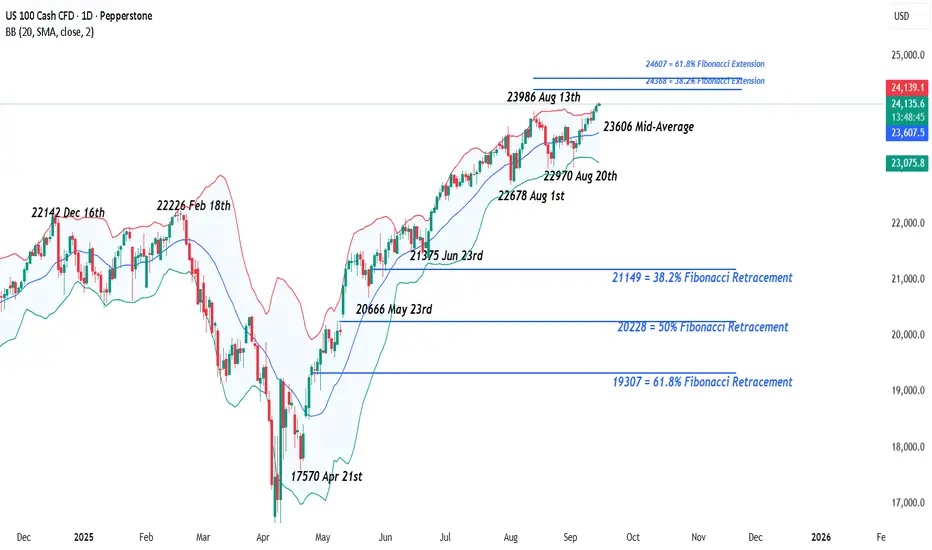
With the US 100 index now entering uncharted territory, traders may be turning their attention to Fibonacci extension levels based on the August 13th to 20th sell-off. The 38.2% extension is at 24368, and if this level is breached, the next potential resistance could be 24607, the 61.8% extension.
Potential Support Levels:
The US 100 recently closed back above the rising Bollinger mid-average, currently at 23606, and so this level could act as the first initial support for the week. If retested, it may be important to monitor whether the market can hold above it on a closing basis.
A closing break below 23606 wouldn’t necessarily signal a negative shift, but it could open the door for a test of 22970, which is the low from August 20th, and potentially lower if that level fails to hold.
The material provided here has not been prepared accordance with legal requirements designed to promote the independence of investment research and as such is considered to be a marketing communication. Whilst it is not subject to any prohibition on dealing ahead of the dissemination of investment research, we will not seek to take any advantage before providing it to our clients.
Pepperstone doesn’t represent that the material provided here is accurate, current or complete, and therefore shouldn’t be relied upon as such. The information, whether from a third party or not, isn’t to be considered as a recommendation; or an offer to buy or sell; or the solicitation of an offer to buy or sell any security, financial product or instrument; or to participate in any particular trading strategy. It does not take into account readers’ financial situation or investment objectives. We advise any readers of this content to seek their own advice. Without the approval of Pepperstone, reproduction or redistribution of this information isn’t permitted.
The standout event could be the Federal Reserve (Fed) interest rate announcement on Wednesday at 1900 BST, which is followed closely by the press conference led by Chairman Powell, which starts at 1930 BST. However, Thursday’s Bank of England interest rate decision at 1200 BST, or Friday’s Bank of Japan interest rate decision due at 0400 BST, and then the press conference led by Governor Ueda may also keep traders on volatility alert.
The US 100 index is the focus of today’s commentary as it can be more sensitive than other indices to interest rate moves made by the Fed.
As can be seen on the daily Pepperstone chart above, the US 100 index has experienced a period of higher highs and higher lows since the 2025 low was hit way back at 16290 on April 7th, helped in no small part by a re-engagement of traders with the potential of artificial intelligence and what it could mean for the future earnings of the leading companies in this space. This AI driver is still in very much in play but may take a backseat this week due to the Federal Reserve rate decision.
Since the surprise weaker than expected US employment report on August 1st (Non-farm payrolls) market expectations for Fed rate cuts have increased, helping to support the latest US 100 uptrend from its August 1st lows at 22678 to print numerous record closing highs, the latest being Friday at 24096.
For the Fed interest rate decision on Wednesday, a 25bps (0.25%) cut is fully priced by traders, but there is a small outside chance of a 50bps (0.5%) cut, a decision which, if it happened, could generate equal amounts of uncertainty that policy makers feel they could be behind the curve in supporting the economy and that the labour market is weakening faster than anticipated, but also surprise that the Fed may be willing to cut rates faster, which as a general rule can be supportive of US100 index gains.
The press conference may also be a relevant consideration for US 100 price volatility. Traders will be keen to hear Chairman Powell’s stance on the possibility for further rate cuts, with economists predicting just one more 25bps cut into the end of 2025, while the market is pricing another 2 25bps reductions. Any comments he makes on the independence of the US central bank, with an appeal court ruling expected imminently on whether President Trump has the authority to sack Fed Governor Cook, as well as his thoughts on the deterioration of the US labour markets and direction of inflation could also be important.
Technical Update: New All-Time Highs Posted
After reaching a new all-time high of 24142 on Friday, the market continues to show signs of a positive trend, which has been evident since the low of 16290 recorded on April 7th.
As the chart above shows, the market has formed a pattern of higher highs and higher lows. While this doesn’t guarantee that prices will continue to rise, the recent new peak suggests there might be further upward momentum ahead.
Although positive sentiment appears to remain in place, this week’s upcoming data releases and interest rate decision could significantly impact price movements.
As a result, it may be important to identify and then monitor key support and resistance levels in case an increased spell of volatility emerges.
Potential Resistance Levels:
Following the recording of the latest all-time high at 24142 on Friday, traders may be anticipating continued attempts at upward momentum to extend the current uptrend.
The outlook suggests that further attempts to push toward the next resistance levels could emerge in the coming week.
With the US 100 index now entering uncharted territory, traders may be turning their attention to Fibonacci extension levels based on the August 13th to 20th sell-off. The 38.2% extension is at 24368, and if this level is breached, the next potential resistance could be 24607, the 61.8% extension.
Potential Support Levels:
The US 100 recently closed back above the rising Bollinger mid-average, currently at 23606, and so this level could act as the first initial support for the week. If retested, it may be important to monitor whether the market can hold above it on a closing basis.
A closing break below 23606 wouldn’t necessarily signal a negative shift, but it could open the door for a test of 22970, which is the low from August 20th, and potentially lower if that level fails to hold.
The material provided here has not been prepared accordance with legal requirements designed to promote the independence of investment research and as such is considered to be a marketing communication. Whilst it is not subject to any prohibition on dealing ahead of the dissemination of investment research, we will not seek to take any advantage before providing it to our clients.
Pepperstone doesn’t represent that the material provided here is accurate, current or complete, and therefore shouldn’t be relied upon as such. The information, whether from a third party or not, isn’t to be considered as a recommendation; or an offer to buy or sell; or the solicitation of an offer to buy or sell any security, financial product or instrument; or to participate in any particular trading strategy. It does not take into account readers’ financial situation or investment objectives. We advise any readers of this content to seek their own advice. Without the approval of Pepperstone, reproduction or redistribution of this information isn’t permitted.
Global risk Warning CFDs are complex instruments and come with a high risk of losing money rapidly due to leverage. Between 74-89% of retail investor accounts lose money when trading in CFDs. You should consider whether you understand how CFD
Disclaimer
The information and publications are not meant to be, and do not constitute, financial, investment, trading, or other types of advice or recommendations supplied or endorsed by TradingView. Read more in the Terms of Use.