The US 100 has edged 0.2% lower to start this pivotal week as traders adjust positioning ahead of the final Federal Reserve meeting of 2025. This is a meeting at which the US central bank is widely expected to cut interest rates by 25bps and with markets pricing around a 90% chance of this happening it could be argued that anything else would be a major shock to the financial system.
Putting that to one side, there could also be challenges for traders to navigate even if the Fed does cut rates as expected, and this is where assessing the price action once the decision is released at 1900 GMT on Wednesday could be crucial.
The US 100 has rallied strongly from its November 21st low at 23834 up to current levels around 25650 at time of writing (0700 GMT). This 1800-point rally coincided with Fed policymakers talking more positively regarding their views on the potential for a further ‘near term’ rate cut, so it could be argued that this is now already priced into US stock indices.
More specifically, the US 100 is up around 21.5% year to date and consideration may need to be given to how motivated investors may be to add to their directional exposure versus locking in gains on what has been a strong 2025 performance.
With this as the backdrop moving into the next 36 hours of trading, assessing the current technical trend, alongside identifying potential key support and resistance levels could help to determine whether a Santa rally or a nasty case of ‘bah humbug’ volatility is more likely moving into the final 3 weeks of 2025.
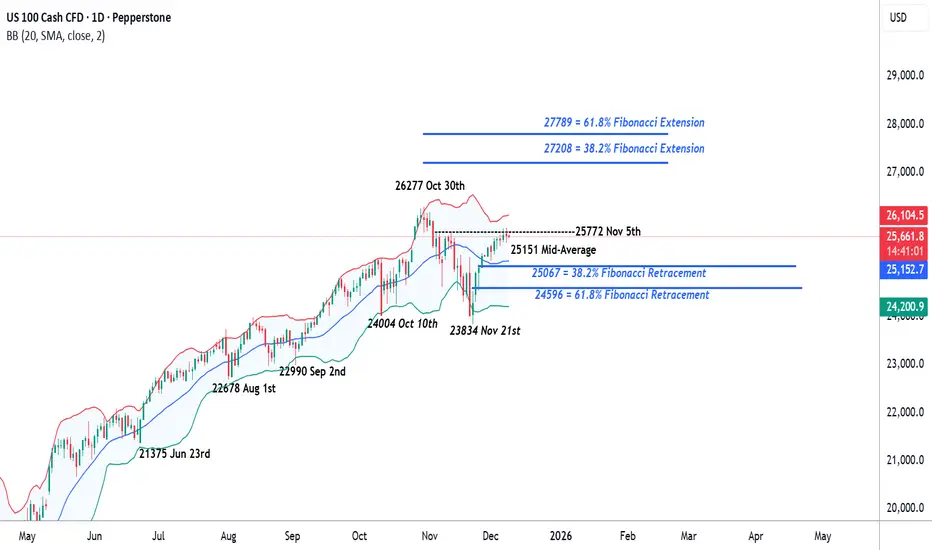
US 100 Index Technical Update: Stalling Against 25772 Resistance?
The US 100 index has staged an impressive 8.4% recovery from the 23834 November 21st low, yet the latest phase of strength may be stalling against potential resistance at 25772. This level, equal to the November 5th session high, has repeatedly capped attempts at fresh price strength throughout November and early December, as the chart below illustrates.

While much will depend on future price activity, traders may now view the 25772 resistance as something of a pivotal level. A successful close above 25772 might be required to open the way for further price strength. However, if 25772 continues to cap prices on a closing basis, the latest upside momentum may be seen as slowing with scope for downside weakness to emerge.
What Next if 25772 Is Broken on a Closing Basis?:
With resistance at 25772 potentially pivotal to future price activity, closing breaks above this level may now be required to sustain a push toward higher levels. Such moves, while not guaranteeing continued upside, could encourage further attempts to extend the latest strength.
Successful closes above 25772 could open the possibility of moves towards 26277, which is the October 30th upside extreme, and if this level were to also be broken, on further toward 27208, which is the 38.2% Fibonacci extension.
What Next if the 25772 Resistance Continues to Hold?:
With the 25772 resistance still intact on a closing basis, it is notable that the new week has once again seen selling pressure emerge around this level. The concern now for the bulls is that the longer 25772 continues to cap price strength, the greater the risk that downside momentum could begin to materialise.
If price weakness does emerge, trader focus may then shift to support offered by the rising Bollinger mid‑average, which currently stands at 25151. A closing break below 25151 could then raise risks of a deeper retracement of the November/December strength, with potential to test 25067, which is the 38.2% retracement, possibly even 24596, a level equal to the 61.8% retracement.
The material provided here has not been prepared accordance with legal requirements designed to promote the independence of investment research and as such is considered to be a marketing communication. Whilst it is not subject to any prohibition on dealing ahead of the dissemination of investment research, we will not seek to take any advantage before providing it to our clients.
Pepperstone doesn’t represent that the material provided here is accurate, current or complete, and therefore shouldn’t be relied upon as such. The information, whether from a third party or not, isn’t to be considered as a recommendation; or an offer to buy or sell; or the solicitation of an offer to buy or sell any security, financial product or instrument; or to participate in any particular trading strategy. It does not take into account readers’ financial situation or investment objectives. We advise any readers of this content to seek their own advice. Without the approval of Pepperstone, reproduction or redistribution of this information isn’t permitted.
Putting that to one side, there could also be challenges for traders to navigate even if the Fed does cut rates as expected, and this is where assessing the price action once the decision is released at 1900 GMT on Wednesday could be crucial.
The US 100 has rallied strongly from its November 21st low at 23834 up to current levels around 25650 at time of writing (0700 GMT). This 1800-point rally coincided with Fed policymakers talking more positively regarding their views on the potential for a further ‘near term’ rate cut, so it could be argued that this is now already priced into US stock indices.
More specifically, the US 100 is up around 21.5% year to date and consideration may need to be given to how motivated investors may be to add to their directional exposure versus locking in gains on what has been a strong 2025 performance.
With this as the backdrop moving into the next 36 hours of trading, assessing the current technical trend, alongside identifying potential key support and resistance levels could help to determine whether a Santa rally or a nasty case of ‘bah humbug’ volatility is more likely moving into the final 3 weeks of 2025.
US 100 Index Technical Update: Stalling Against 25772 Resistance?
The US 100 index has staged an impressive 8.4% recovery from the 23834 November 21st low, yet the latest phase of strength may be stalling against potential resistance at 25772. This level, equal to the November 5th session high, has repeatedly capped attempts at fresh price strength throughout November and early December, as the chart below illustrates.
While much will depend on future price activity, traders may now view the 25772 resistance as something of a pivotal level. A successful close above 25772 might be required to open the way for further price strength. However, if 25772 continues to cap prices on a closing basis, the latest upside momentum may be seen as slowing with scope for downside weakness to emerge.
What Next if 25772 Is Broken on a Closing Basis?:
With resistance at 25772 potentially pivotal to future price activity, closing breaks above this level may now be required to sustain a push toward higher levels. Such moves, while not guaranteeing continued upside, could encourage further attempts to extend the latest strength.
Successful closes above 25772 could open the possibility of moves towards 26277, which is the October 30th upside extreme, and if this level were to also be broken, on further toward 27208, which is the 38.2% Fibonacci extension.
What Next if the 25772 Resistance Continues to Hold?:
With the 25772 resistance still intact on a closing basis, it is notable that the new week has once again seen selling pressure emerge around this level. The concern now for the bulls is that the longer 25772 continues to cap price strength, the greater the risk that downside momentum could begin to materialise.
If price weakness does emerge, trader focus may then shift to support offered by the rising Bollinger mid‑average, which currently stands at 25151. A closing break below 25151 could then raise risks of a deeper retracement of the November/December strength, with potential to test 25067, which is the 38.2% retracement, possibly even 24596, a level equal to the 61.8% retracement.
The material provided here has not been prepared accordance with legal requirements designed to promote the independence of investment research and as such is considered to be a marketing communication. Whilst it is not subject to any prohibition on dealing ahead of the dissemination of investment research, we will not seek to take any advantage before providing it to our clients.
Pepperstone doesn’t represent that the material provided here is accurate, current or complete, and therefore shouldn’t be relied upon as such. The information, whether from a third party or not, isn’t to be considered as a recommendation; or an offer to buy or sell; or the solicitation of an offer to buy or sell any security, financial product or instrument; or to participate in any particular trading strategy. It does not take into account readers’ financial situation or investment objectives. We advise any readers of this content to seek their own advice. Without the approval of Pepperstone, reproduction or redistribution of this information isn’t permitted.
Global risk Warning CFDs are complex instruments and come with a high risk of losing money rapidly due to leverage. Between 74-89% of retail investor accounts lose money when trading in CFDs. You should consider whether you understand how CFD
Disclaimer
The information and publications are not meant to be, and do not constitute, financial, investment, trading, or other types of advice or recommendations supplied or endorsed by TradingView. Read more in the Terms of Use.